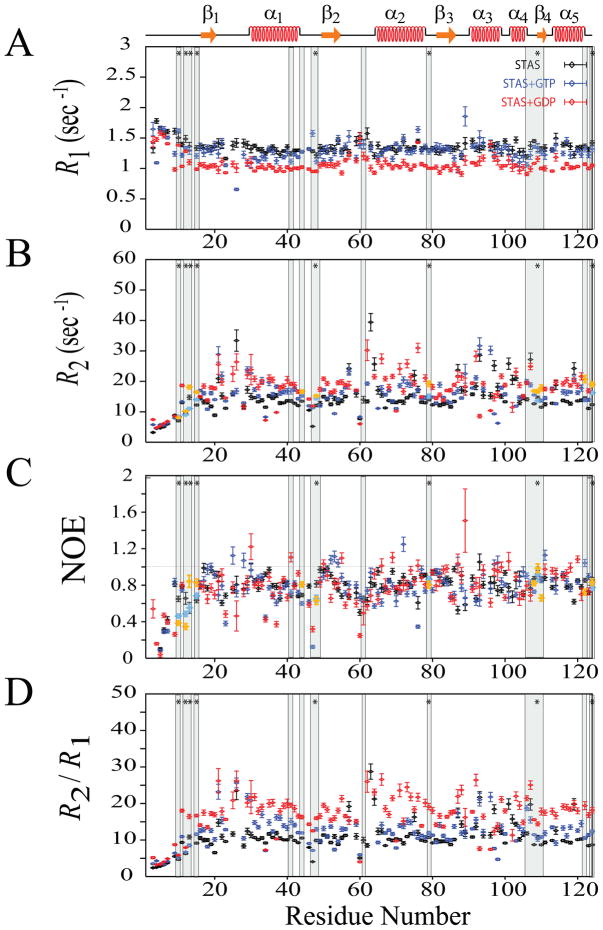
Fig. 4.
15N-relaxation data for unliganded Rv1739c STAS, (~0.5 mM in 50 mM Na phosphate, pH 7.2, 275 mM NaCl) and for Rv1739c STAS in the presence of 20 mM GTP and 20 mM GDP recorded at 600.13 MHz, 300 K. (A) Superposed sequence-specific longitudinal relaxation rates (R1). (B) Superposed sequence-specific transverse relaxation rates (R2). (C) Superposed sequence-specific {1H}-15N heteronuclear NOEs. (D) Superposed sequence-specific R2/R1 ratios. Shaded bars highlight residues experiencing chemical shift perturbation (CSP) upon nucleotide binding; bars marked by ‘*’ indicate residues perturbed by both GTP and GDP {15}. CSP residues that exhibit increased R2 and J(0) and decreased NOE and J(ωN) values are aquamarine for GTP and yellow for GDP; see text for details. STAS secondary structure is shown at top.

