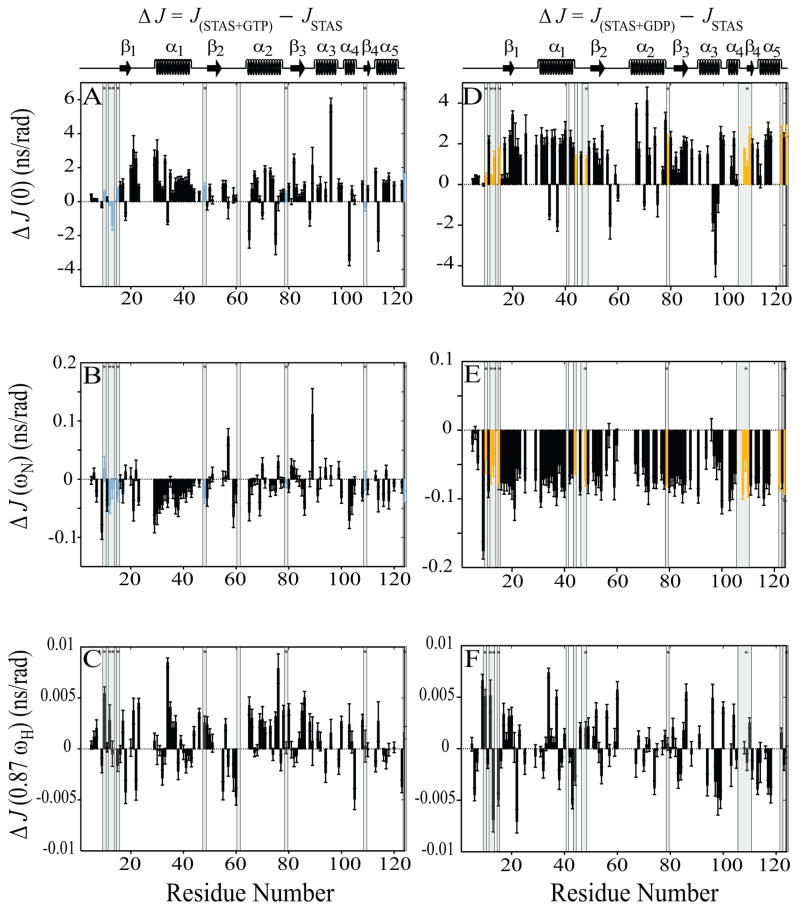
Fig. 6.
Sequence-specific reduced spectral density function value differences (ΔJ) between nucleotide-bound and free STAS. Left panels, (A–C),ΔJ between GTP-bound STAS and free STAS; Right panels, (D-F), ΔJ between GDP-bound STAS and free STAS. (A & D) ΔJ(0), (B & E) ΔJ(ωN), and (C & F) ΔJ (0.87ωH). Shaded bars highlight residues experiencing chemical shift perturbation (CSP) upon nucleotide binding; bars marked by ‘*’ indicate residues perturbed by both GTP and GDP {15}. CSP residues that exhibit increased R2 and J(0) and decreased NOE and J(ωN) values are aquamarine for GTP and yellow for GDP. STAS secondary structure is at top of each column of panels.

