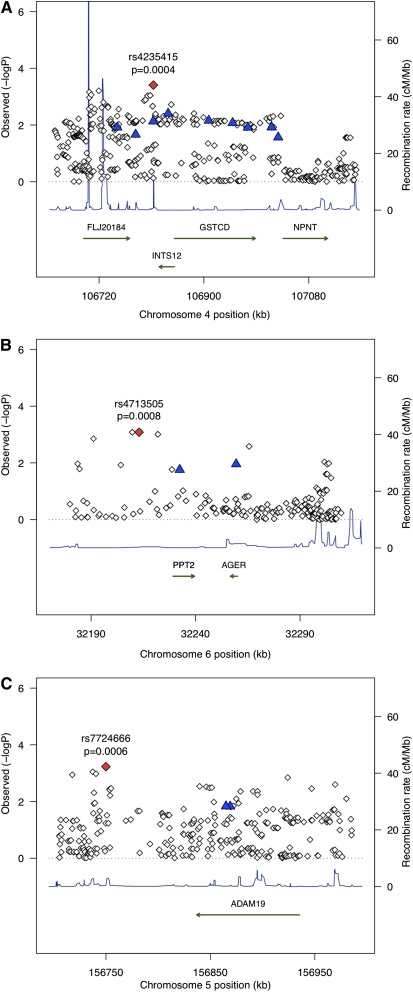
Figure 2.
Localization plots showing the results of association testing for COPD susceptibility loci at 4q24 (A), 6p21 (B), and 5q33 (C). The red diamond marks the most strongly associated SNP in our study, and the blue triangles represent SNPs identified in pulmonary function GWA metaanalyses. Analyzed genes are depicted with green arrows, and recombination rates based on HapMap data are represented as blue triangles.

