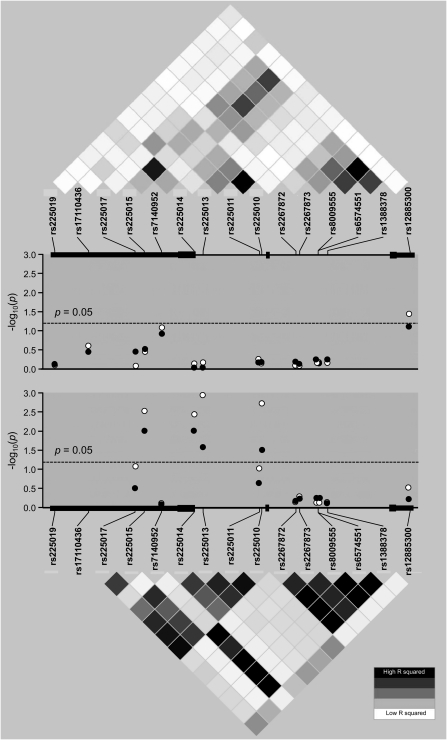
Figure 5.
Plots of association P values of tested DIO2 tagging and imputed single-nucleotide polymorphisms (SNPs) with severe sepsis and severe sepsis–associated ALI. Depicted are association P values of tested DIO2 tagging and imputed SNPs for African Americans (top panel) and European Americans (bottom panel). Dashed line represents a P value of 0.05. Closed circles depict association with severe sepsis, and open circles depict association with severe sepsis–associated ALI. For reference, a linkage disequilibrium (LD) plot of r2 values is shown for the SNPs of the gene. Each diamond of the LD plot represents a pairwise SNP comparison, with its r2 value schematically symbolized by a color gradient, ranging from black (r2 = 1, complete LD) to gray (1 ≤ r2 ≤ 0, moderate LD) and white (r2 = 0, absence of LD).

