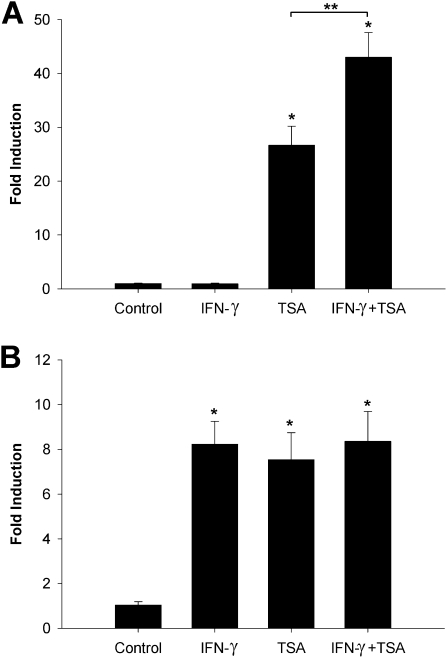
Figure 7.
Role of histone acetylation in IFN-γ–inducible EC-SOD expression. HPAECs (A) and HPASMCs (B) were exposed to either IFN-γ (5,000 U/ml) or TSA (1.5 μM) or a combination of both substances for 48 hours. Total RNA was extracted, and EC-SOD mRNA was measured by quantitative real-time RT-PCR. The data were normalized to concentrations of GAPDH mRNA. The results shown represent the mean ± SD from at least two independent experiments. *P < 0.001, compared with nontreated cells, according to ANOVA/Bonferroni post hoc test. **P < 0.01, according to t test.

