Figure 1.

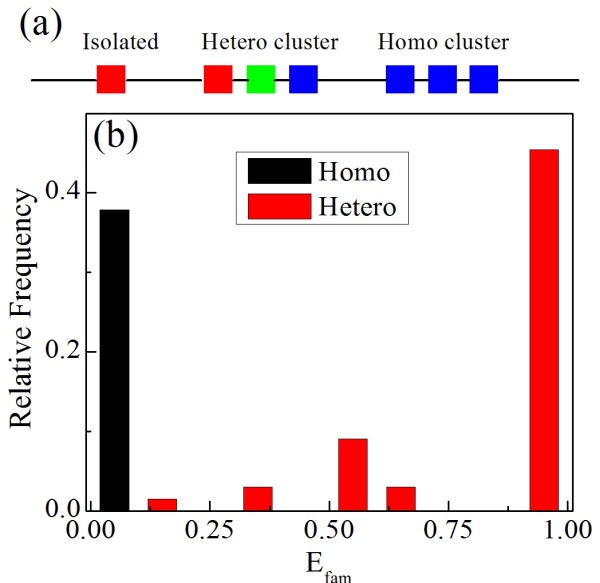
Homo-clusters and hetero-clusters of miRNA. a) Illustration of miRNA distributions in genome. The miRNAs of the same family are represented as squares of the same color; b) family entropy distribution of miRNA clusters.

Homo-clusters and hetero-clusters of miRNA. a) Illustration of miRNA distributions in genome. The miRNAs of the same family are represented as squares of the same color; b) family entropy distribution of miRNA clusters.