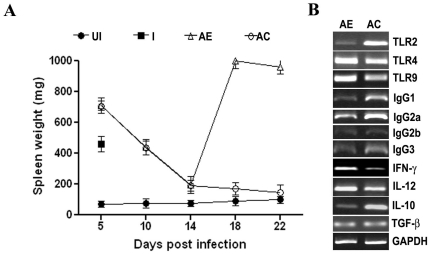
Figure 3. Effect of AE and AC-treatments on changes in spleen mass and mRNA levels of cytokines, TLRs and IgG-sub-class antibodies in P.berghei-infected mice.
(A) Changes in spleen weight through out the course of infection and drug treatments. Data provided represent Mean ± S.D. from five animals. *, infected animals died 5/6 day (B) Semi-quantitative RT-PCR analysis of spleen RNA on day 14. UI, unifected; I, infected; AE, ART alone; AC, ART+CUR.

