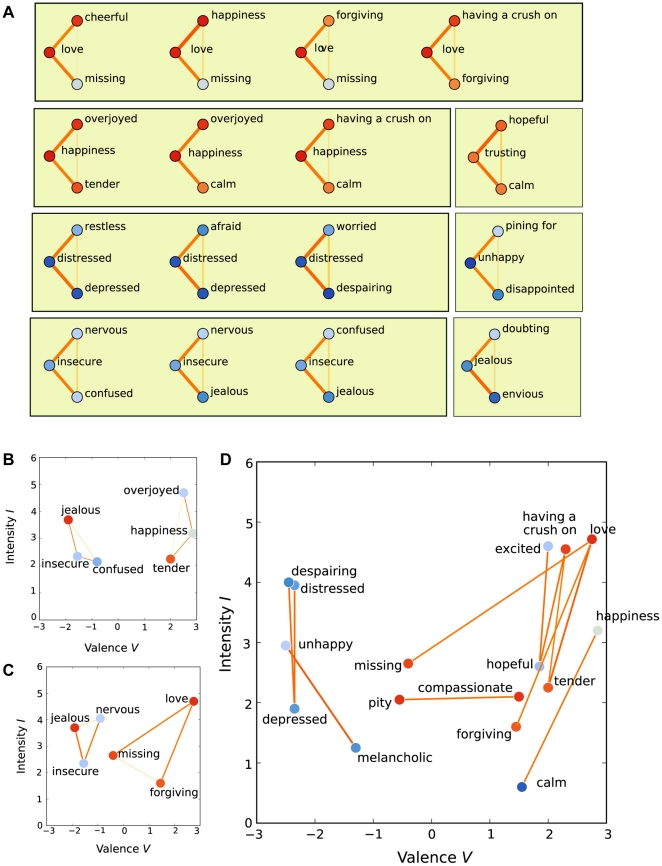
Figure 7. The imbalanced triplets.
(A) The most imbalanced 16 concept triplets, in which one concept is perceived very similar to two others, whereas these two are perceived very different. The concepts are colored by their mean valence evaluations. The similarity between each concept pair is shown by link color and width, using color scales as in Fig. 3. (B) Two examples of imbalanced triplets shown on the valence-intensity (V-I) plane, where the coordinates are from mean valence and intensity evaluations of the emotion concepts. In these examples, the central concept is located between the dissimilar concepts. The concepts in panels B–D are colored by interactivity, using color scales as in Fig. 3. (C) Two more examples of imbalanced triplets on the V-I plane, where the least similar pair turns out to be located closest in the V-I-plane. (D) Concept pairs with strong similarities (s≥3.0) that are distant in the V-I-plane (Euclidian distance d≥2.0).

