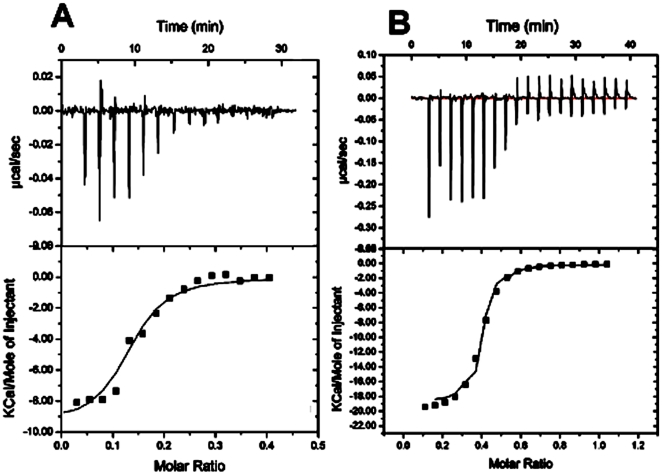
Figure 8. ITC profile for the binding of fsRNA3 (R3) to Dai (A) and Kae (B) at 25°C in 50 mM Tris–HCl buffer containing 150 mM NaCl and 0.1% DMSO (pH 7.3).
The top panels represent the raw data for sequential injection of RNA into the ligands (curves on the bottom) and RNA dilution control (curves offset for clarity). The bottom panels show the integrated heat data after correcting for the heat of dilution of RNA against the molar ratio of Kae to RNA. The data (open squares) were fitted to a one-site model and the solid lines represent the best fit of the data.

