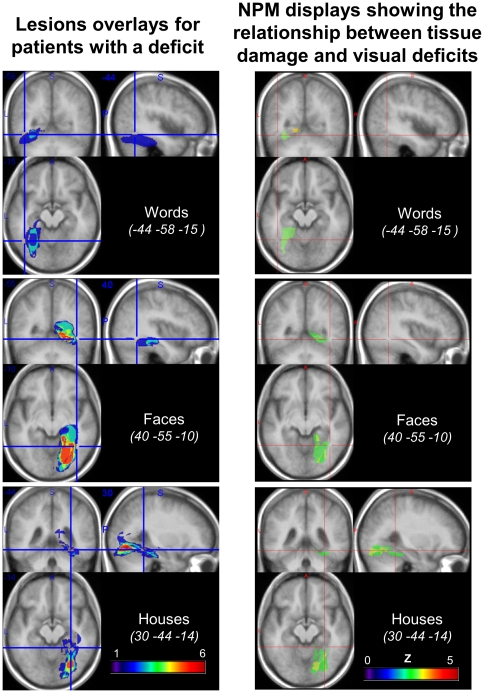
Figure 8. Lesion analysis.
Voxel-based lesion-symptom mapping (VLSM, right panel), comparing the performance of patients with and without a lesion of each voxel, with voxelwise Z statistics corrected for multiple comparisons over the whole brain (threshold: FDR p<0.05). Significant regions are contiguous to the peaks of the corresponding functional areas as identified in normal subjects (red crosshair). Addition of normalized lesions (left panel) for patients with a deficit for words (n = 3; top panel), faces (n = 9; middle panel), and houses (n = 10; bottom panel), minus the lesions of patients with no deficit in the considered category. The regions of maximum overlap are essentially identical to those identified using VLSM.

