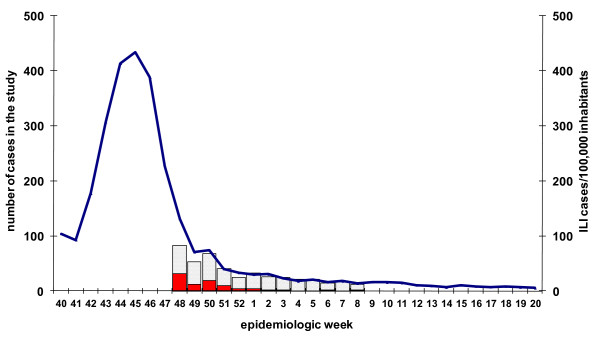
Figure 2.
cycEVA study ILI cases (N = 436) and ILI incidence in the participating regions, season 2009-2010, Spain. Pandemic influenza laboratory positive cases (red), laboratory negative controls (grey grid) and Influenza-like illness incidence per 100,000 inhabitants in the seven participating Spanish regions (blue line) by week of swabbing in the cycEVA study.

