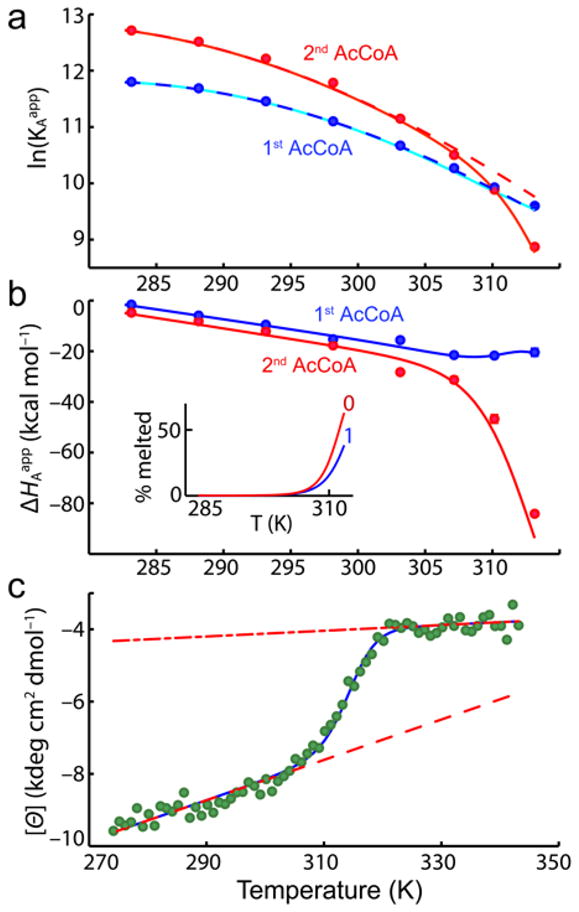
Figure 2.

Temperature dependence of AAC(6′)-Ii binding thermodynamics and secondary structure. (a) Equilibrium association constants for the first and second molecules of AcCoA, plotted as a function of temperature. Solid lines correspond to the best fit obtained with Eqs. 2 to 9. Dashed lines indicate the predicted affinities in the absence of thermal melting of the subunits. (b) Binding enthalpies of the first and second molecules of AcCoA. Inset shows the fraction of free subunits that are melted in the 0-bound and 1-bound forms. (c) Molar ellipticity (222 nm) of AAC(6′)-Ii as a function of temperature. Dashed and dash-dot lines correspond to the pre- and post-transition baselines, respectively.
