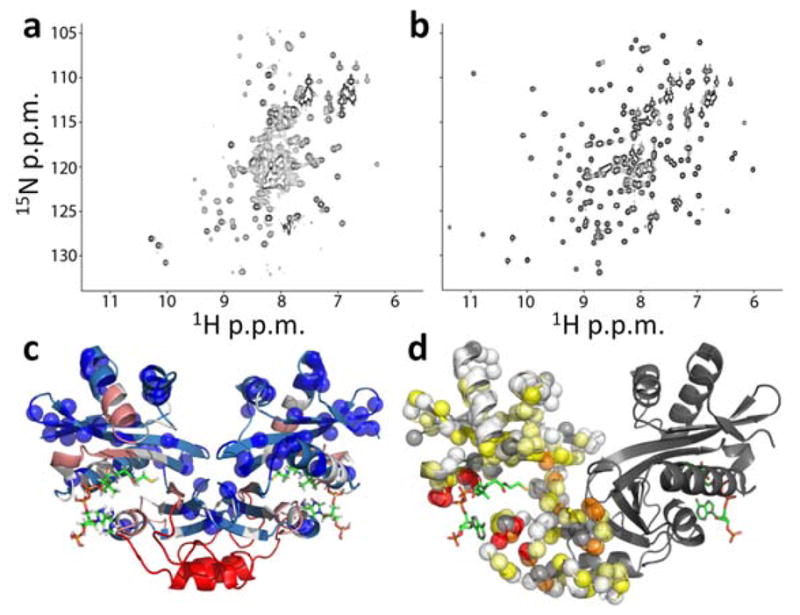
Figure 3.

Changes in AAC(6′)-Ii NMR spectra produced by AcCoA binding. (a,b) 1H/15N correlation spectra of AAC(6′)-Ii free (a) and saturated with AcCoA (b). (c) X-ray crystal structure of the enzyme (PDB 2A4N25) bound to CoA (sticks) with blue spheres indicating the locations of residues with assigned cross-peaks in apo spectra. The backbone is color-coded according to the distance in the 1° sequence (n) from the nearest assigned residue according to 1≤n≤2 (light blue), 3≤n≤5 (white), 6≤n≤10 (pink), n>10 (red) (d) Apparent minimal chemical shift differences ( ) between the free and bound states, mapped onto the X-ray crystal structure (PDB 2A4N25). Backbone amide nitrogen atoms are indicated with spheres for one subunit of the dimer and colored according to Δδapp<0.5 ppm (white), 0.5≤Δδapp<1 (light yellow), 1≤Δδapp<2 (yellow), 2≤Δδapp<4 (orange), 4≤Δδapp (red). Unassigned residues, including prolines, are indicated with gray spheres. Structures were generated using PyMOL.
