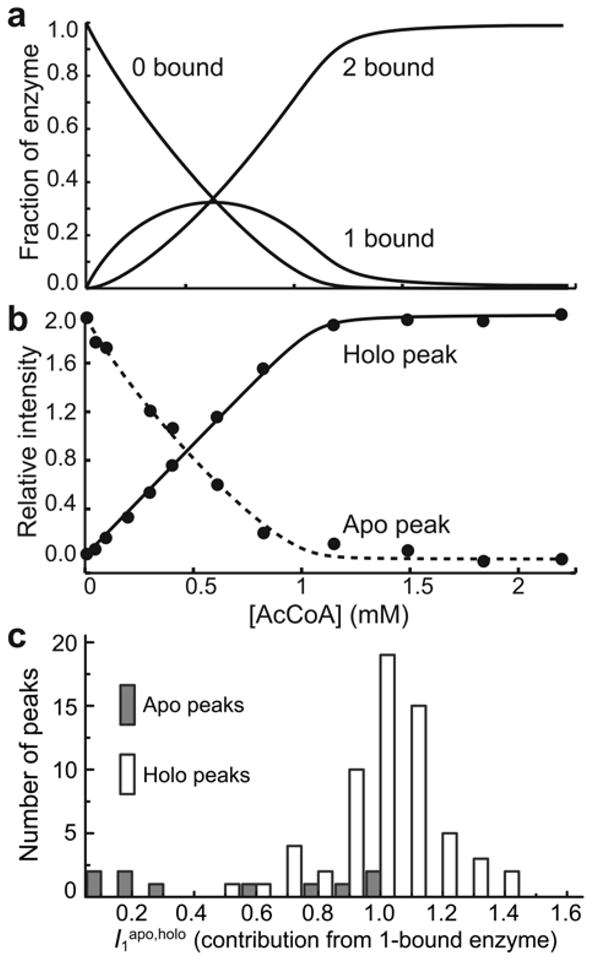
Figure 4.

Analysis of NMR titration data. (a) Fraction of the enzyme in the 0-bound, 1-bound, and 2-bound states determined by ITC. (b) Intensities of the apo (dashed line) and holo (solid line) peaks for Leu56 as a function of [AcCoA]. The intensities were analyzed to extract the relative contribution of the 1-bound enzyme to the signals (I1apo,holo) as described in the text. The lines correspond to the optimized theoretical intensities. (c) Histograms of the relative contribution of the 1-bound enzyme to apo (I1apo) and holo (I1holo) peaks in titrations of AAC(6′)-Ii with AcCoA.
