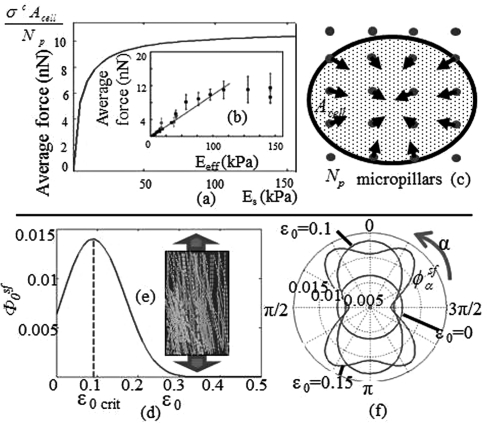
Figure 2.
(Color online) Effect of an isotropic substrate stiffness increase on cell contractility as predicted by (a) the model and (b) experimental methods.10 (c) Schematic representation of experimental set up in Ref. 10, with . The effect of constant stretch on the volume fraction of SF in direction α = 0 is shown in (d), and (e) shows the orientation and disassembly of myofibrils (when overstretched)11 with the arrows representing the direction of stretch. (f) is the angular distribution.

