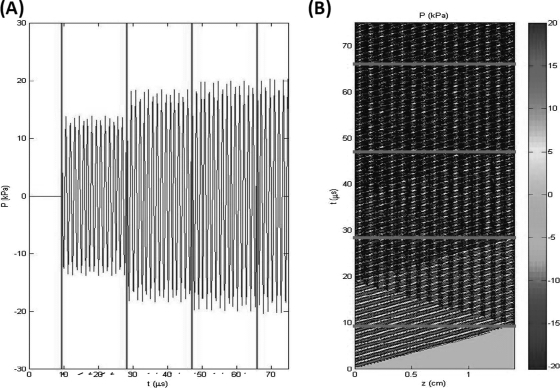
Figure 7.
(Color online) (a) The pressure fluctuations at the dynamic boundary () is shown over a time period of . Four different phases, each with increasing average pressure amplitude, can clearly be seen. Each phase corresponds to the time it takes a reflected wave to reach the boundary and . (b) The contour graph clearly shows the effect of the destructive interference of the reflected wave in the regions and . When , the pressure amplitude reaches a steady state.

