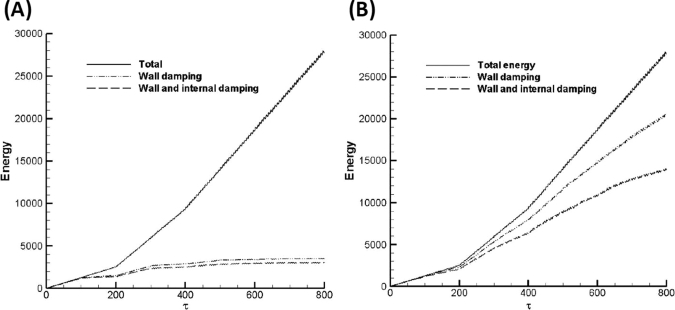
Figure 8.
Total energy in the system (scaled). Three cases are presented: forcing only with , and (i.e. ) shown as the solid line, only wall damping (), shown as the dash-dot line and the dash-line presents the case of wall damping and internal damping (). (a) When , wall damping is the primary method of energy dissipation. (b) Much less energy is dissipated by the dynamic boundary when .

