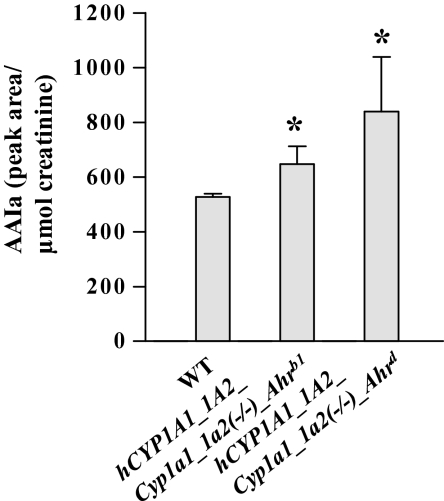
FIG. 3.
Urinary AAIa levels in CYP1A-humanized and WT mice (Arlt et al., 2011a) treated orally with 50 mg/kg body weight AAI for 24 h. All values are given as means ± SD (n = 4). Comparison was performed by t-test analysis; *p < 0.01, different from WT.

