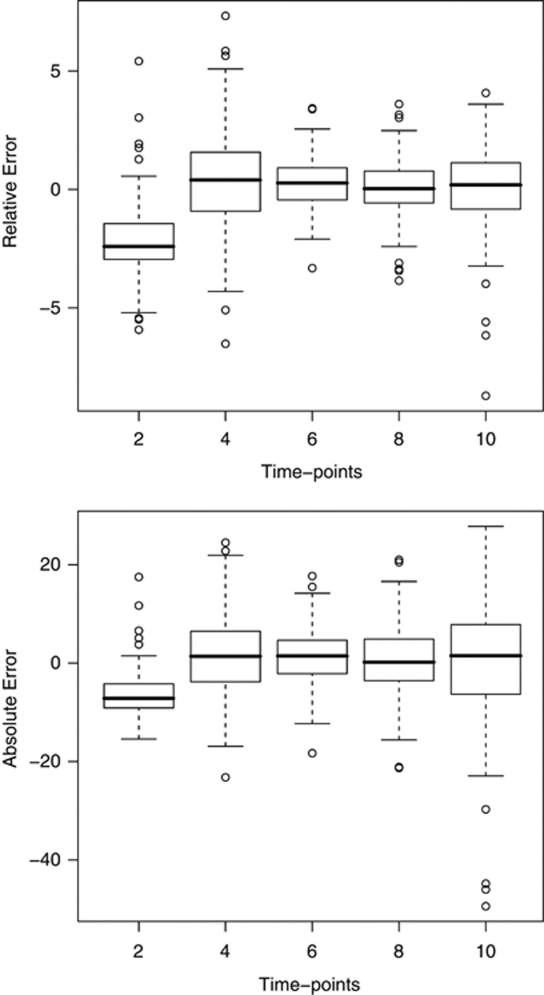
Figure 2.
The prediction accuracy of the phenotypes in the Scots pine data. Boxplots of relative errors (top) and absolute errors (bottom) for predicted phenotypes at five time points, which had increased missingness. Errors are shown on the y-axis and the time-points on the x-axis. The absolute error is calculated as difference between predicted (posterior mean) and true phenotype and relative error is obtained as 100 times absolute error divided by the absolute value of the true phenotype.

