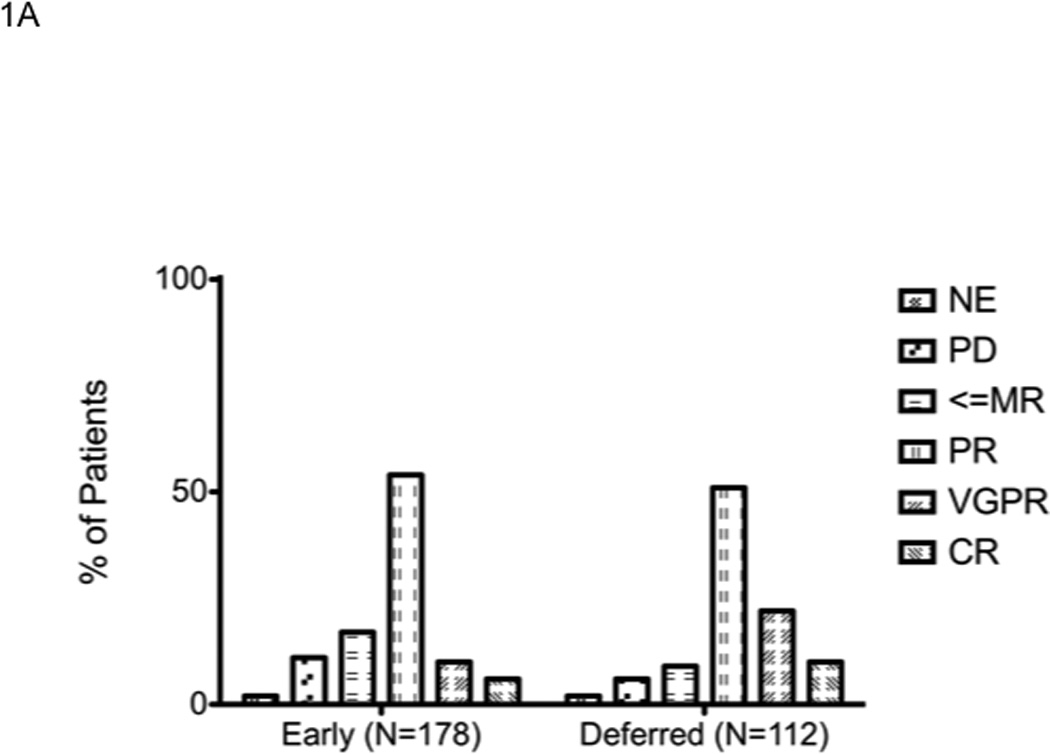
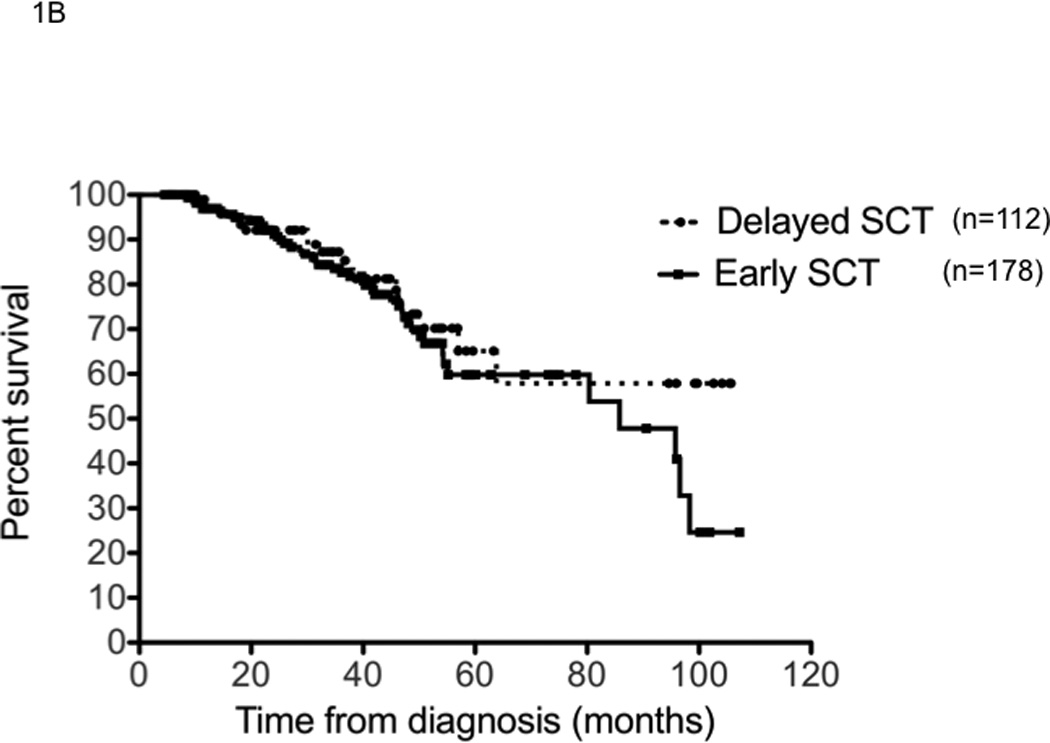
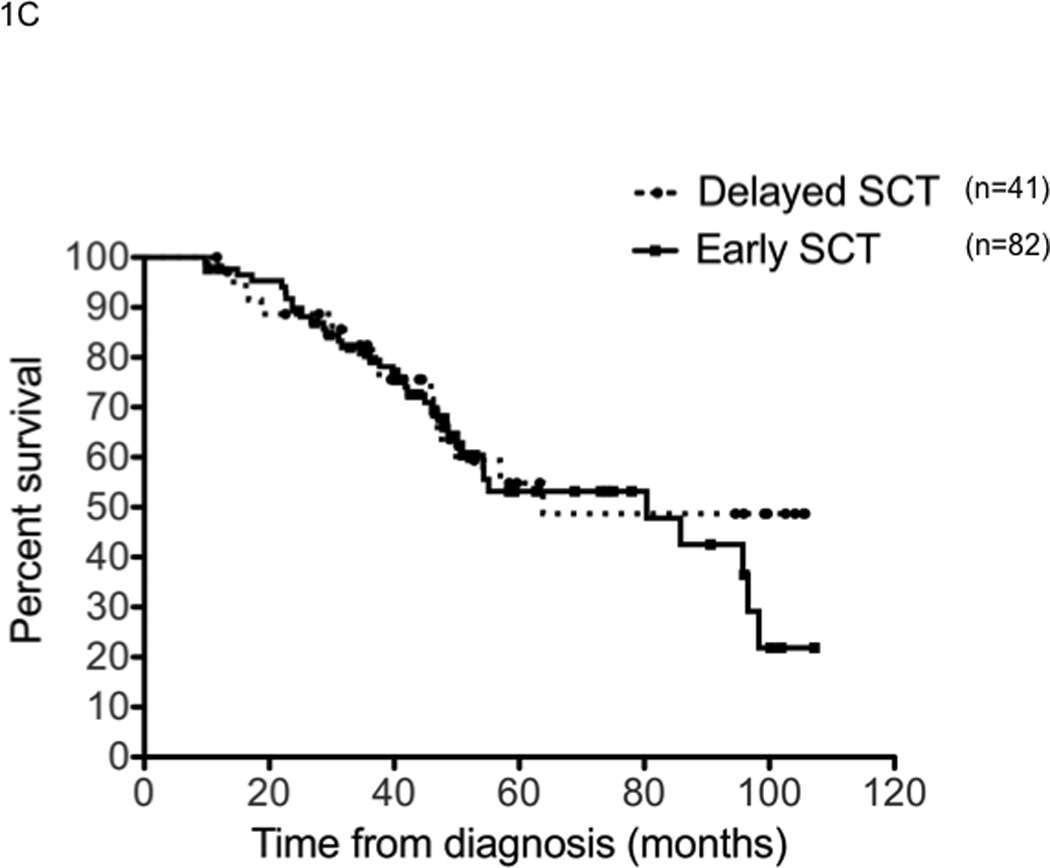
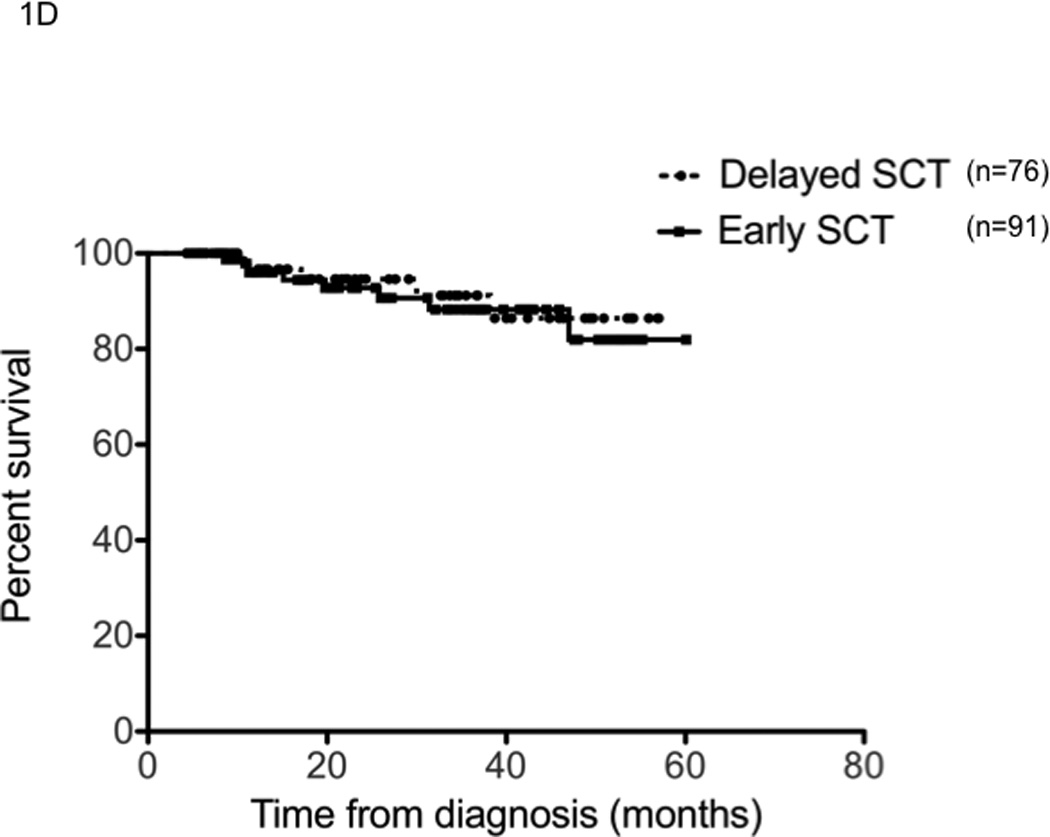
Figure 1.


Panel A represents the response status at the time of stem cell harvest. X-axis represents the response category (NE: not evaluable; PD: progressive disease; <=MR: Minimal response or less; PR: partial response; VGPR: very good partial response; and CR: complete response) in that order (left to right) for each group of patients. Y-axis represents the proportion of patients in each response category, within each patient group. Panel B represents the overall survival from the initiation the first therapy for diagnosis of multiple myeloma for the entire patient group (n=290). Panel C represents the overall survival from the initiation the first therapy for diagnosis of multiple myeloma for patients receiving initial therapy with thalidomide and dexamethasone (n=123). Panel D represents the overall survival from the initiation the first therapy for diagnosis if multiple myeloma for patients receiving initial therapy with lenalidomide and dexamethasone (n=167).
