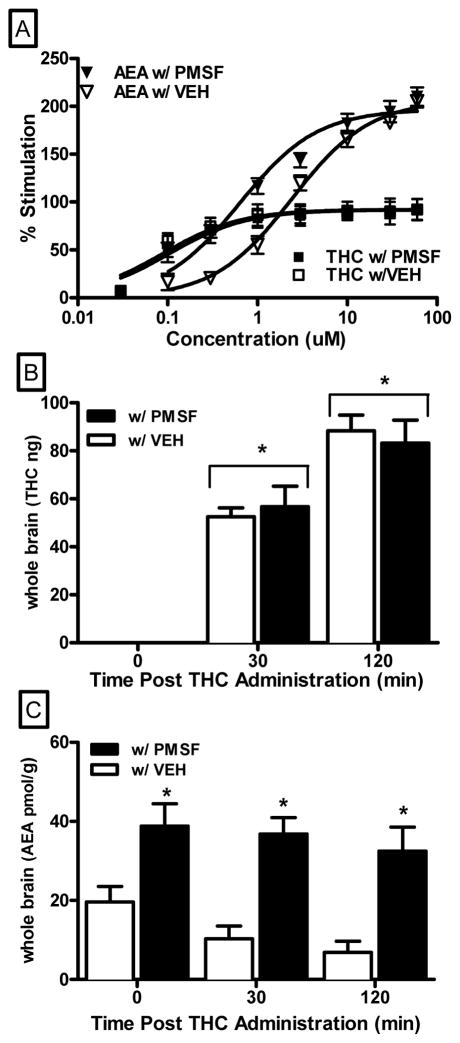
Figure 4.
Effect of PMSF (900 nM) on anandamide and THC stimulated CB1 mediated G-protein activation (panel A). Whole brain levels of THC (ng, panel B), and anandamide (pmol/g, panel C) at 0, 30 and 120 min following 20 mg/kg i.p. injection of THC +/− 30 mg/kg PMSF . 0 time point indicates THC and anandamide levels in animals that received a PMSF injection, then a vehicle injection 20 min later, and then immediately euthanized. Asterisk (*) symbol indicates a significant difference compared to time 0 (panel B) or to vehicle treatment (panel C); i.e., main effect for time or pre-treatment, respectively.

