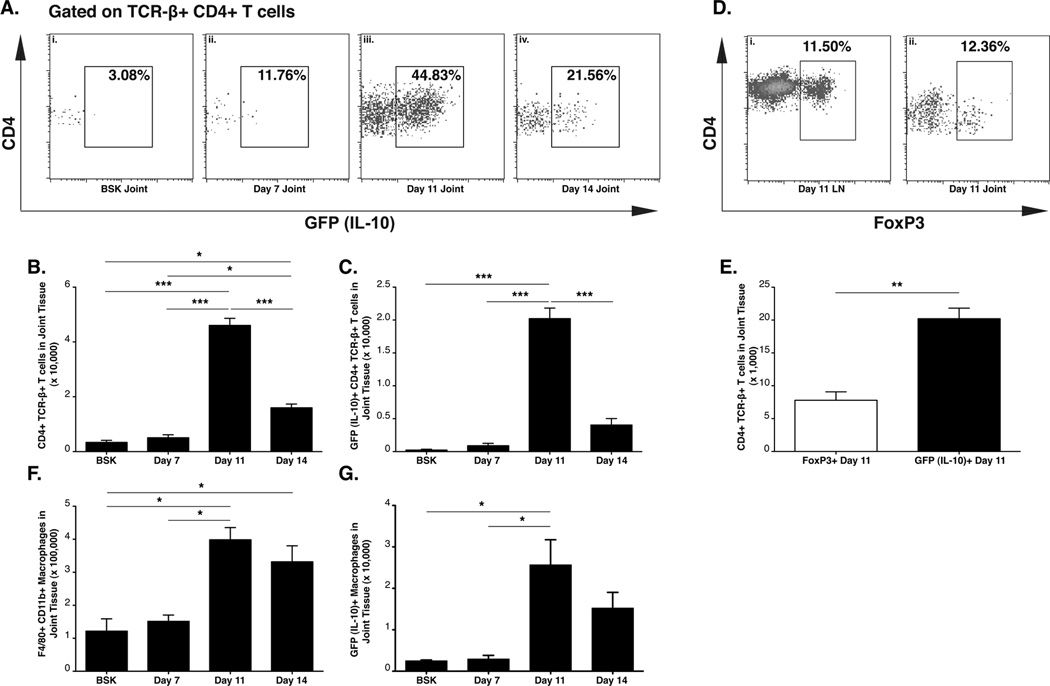
Figure 3. Kinetic analysis of IL-10 expressing cells in tiger mice.
Control and infected IL-10 GFP reporter mouse ‘tiger’ (N=3 per group) were analyzed for IL-10 (GFP) producing CD4+ T cells and macrophages in joint tissue. Flow cytometry analysis of IL-10 expression in joint CD4+ TCR-β+ T cells from uninfected mice (A-i), or mice at day 7 post infection (A-ii), day 11 post infection (A-iii), and day 14 post infection (A-iv). Total joint CD4+ TCR-β+ T cells (B) and total IL-10 (GFP)+ CD4+ TCR-β+ T cells (C). Frequency of CD4+ TCR-β+ FoxP3+ Treg cells in lymph nodes and joint tissue at day 11 post infection (D). Comparison of total joint IL-10 (GFP)+ CD4+ TCR-β+ T cells and total joint CD4+ TCR-β+ FoxP3+ Treg cells in joint tissue at day 11 post infection (E). Total CD11b+, F4/80+ macrophages (F), and IL-10 (GFP)+ CD11b+, F4/80+ macrophages (G) in joint tissue. Statistical analyses were performed as reported in Materials and Methods. Statistical significance in (E) was determined using student’s T test.

