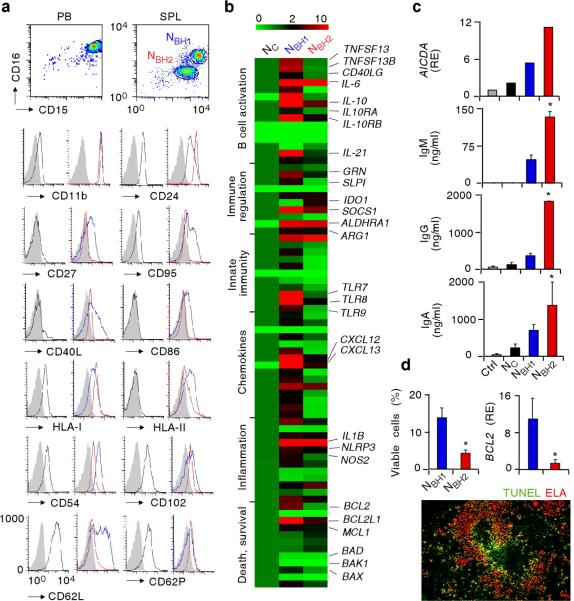
Figure 3. NBH cells include NBH1 and NBH2 subsets distinct from NC cells.
(a) Flow cytometry of CD15, CD16, CD11b, CD24, CD27, CD95, CD40L, CD86, HLA-I, HLA-II, CD54, CD102, CD62L and CD62P on CD15highCD16high NC cells from peripheral blood (PB, black profiles), or splenic (SPL) CD15intCD16int NBH1 cells (blue profiles) and CD15lowCD16low NBH2 cells (red profiles). Filled gray profile, isotype control. (b) Gene expression profile of NC, NBH1 and NBH2 cells established by customized qRT-PCR arrays. Results are normalized to ACTB mRNA (encoding β-actin) and presented as relative expression compared with that of NC cells. Functional mRNA clusters and highly relevant mRNAs are indicated. TNFSF13, TNFSF13B, CD40LG, IL10RA, IL10RB, GRN, IDO1, ALDHRA1, ARG1, IL1B, NLRP3, NOS2 and BCL2L1 mRNAs encode APRIL, BAFF, CD40L, IL-10 receptor α, IL-10 receptor β, progranulin, IDO, RALDH, arginase I, IL-1β, NALP-3, iNOS and Bcl-xL, respectively. The color-ratio bar indicates high (red), low (green) and medium (black) gene expression intensity. (c) qRT-PCR of AICDA (encoding AID) and ELISA of IgM, IgG and IgA from MZ B cells cultured with medium (Ctrl), NC, NBH1 or NBH2 cells for 2 d (AICDA) and 4 d (Igs). Results are normalized to PAX5 mRNA (encoding Pax5) and are presented as relative expression (RE) compared with MZ B cells incubated with medium. (d) Flow cytometry of viable NBH1 and NBH2 cells cultured for 18 h with medium (top left panel), qRT-PCR of BCL2 mRNA (top right panel), and immunofluorescence of spleen stained for TUNEL-positive apoptotic DNA (green) and ELA (red). Results are normalized to ACTB mRNA (encoding β-actin) and are presented as RE compared with that of NC cells. Original magnification, ×10. Error bars, s.e.m.; * P < 0.05 (one-tailed unpaired Student's t-test). Data are from one of three experiments with similar results (a, top c panel, bottom d panel) or summarize three independent experiments (b, mid-bottom c panels, top d panels).

