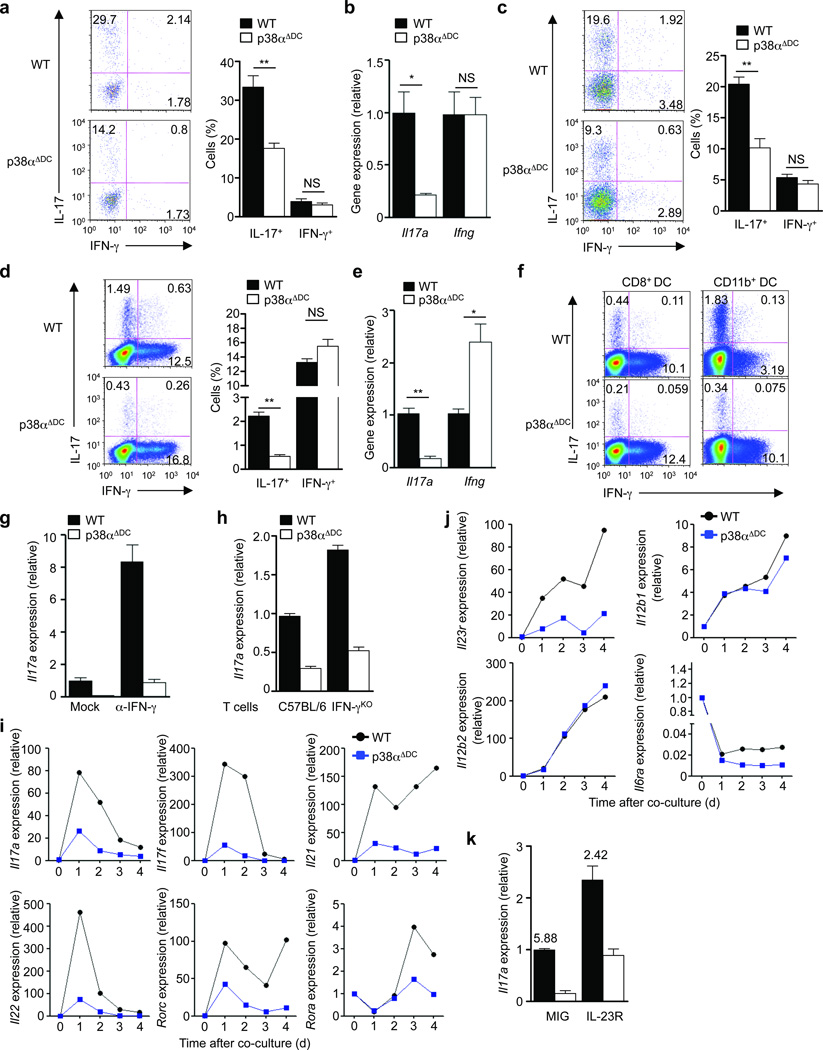
Figure 3. p38α signaling in DCs drives TH17 differentiation in vivo and in vitro and imprints IL-23R expression in responding T cells.
(a) Expression of IL-17 and IFN-γ in the MOG TCR-transgenic donor population (Thy1.1+) of draining LN cells from wild-type (WT) or p38αΔDC mice immunized with MOG + CFA. Right, the proportions of IL-17+ and IFN-γ+ populations among donor CD4+ T cells. (b) Analysis of Il17a and Ifng mRNA in draining LN cells isolated from (a) after stimulation with MOG for 48 h. (c) Expression of IL-17 and IFN-γ in the OT-II donor population (Thy1.1+) of draining LN cells from mice immunized with OVA + CFA. Right, the proportions of IL-17+ and IFN-γ+ populations among donor CD4+ T cells. (d) Expression of IL-17 and IFN-γ in OT-II T cells activated with LPS-pulsed wild-type or p38αΔDC DCs for 5 days, followed by PMA and ionomycin stimulation. Right, the proportions of IL-17+ and IFN-γ+ populations. (e) Analysis of Il17a and Ifng mRNA in T cells from (d) after brief α-CD3 stimulation. (f) Expression of IL-17 and IFN-γ in OT-II T cells activated with antigen and LPS-pulsed CD8+ DCs or CD11b+ DCs for 5 days. (g) Analysis of Il17a mRNA in T cells activated with LPS-pulsed wild-type or p38αΔDC DCs in the presence or absence of α-IFN-γ for 5 days. (h) Analysis of Il17a mRNA in T cells from C57BL/6 or IFN-αKO mice stimulated with α-CD3 and LPS-pulsed wild-type or p38αΔDC DCs for 5 days. (i,j) RNA analysis of T cells activated with wild-type or p38αΔDC DCs for various times for expression of cytokines, transcription factors (i) and cytokine receptors (j). (k) Analysis of Il17a mRNA in T cells activated with wild-type or p38αΔDC DCs and transduced with control (MIG) or IL-23R expressing retrovirus. The numbers above the bars indicate the ratios of Il17a mRNA expression between wild-type and p38αΔDC DC-stimulated T cells. NS, not significant; *P < 0.05; **P < 0.01 (Student’s t-test). Data are representative of 2 (a–c, n≥5 mice per group; f–j, n=4 mice per group), 3 (k, n=4 mice per group) and 4 (d–e, n=4 mice per group) independent experiments. Error bars indicate SEM.

