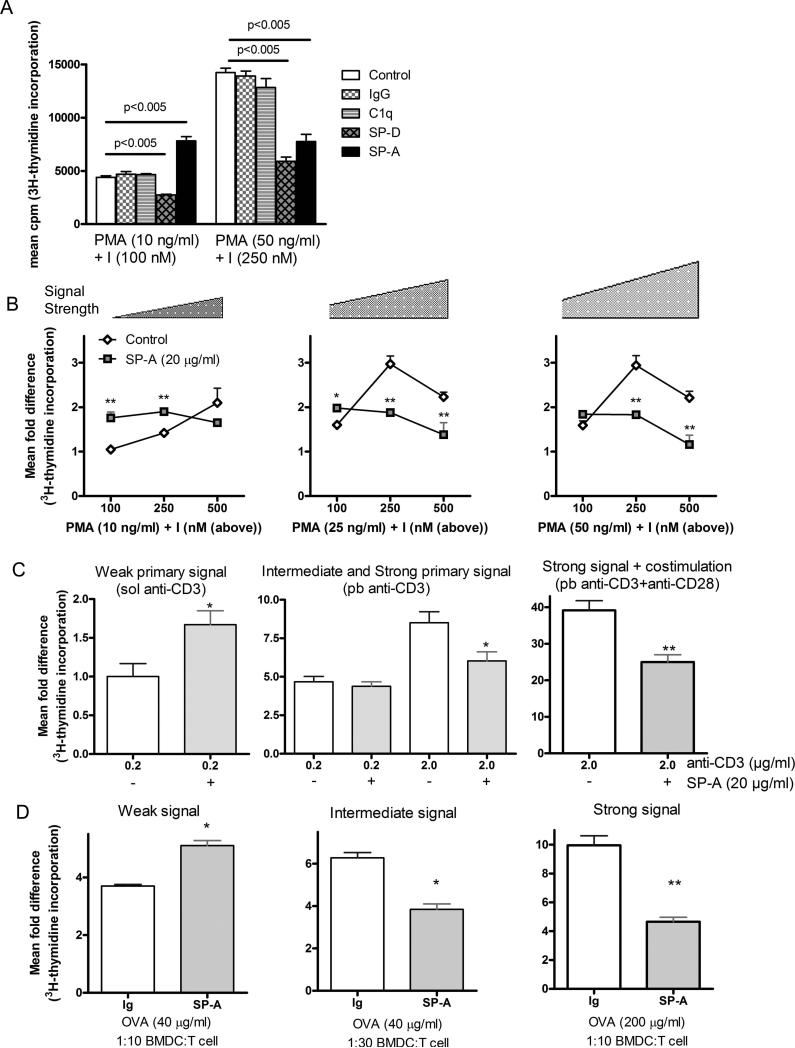
Figure 4. SP-A mediated modulation of T cell proliferation is specific and depends upon the strength of activating signal.
Primary mouse T cells were purified and activated with the indicated proteins (20 μg/ml) and defined amounts of PMA+I or anti-CD3 ± anti-CD28 for 50 h with a [3H]-thymidine pulse during the last 15 h. Data is represented as mean cpm (4A) or as fold difference normalized to the lowest dose of PMA+I (4B) or soluble anti-CD3 alone (4C) and are representative of 3-6 independent experiments with pooled cells obtained from 5-9 mice per experiment. A total of nine different concentrations of PMA and I covering a range of defined signal strengths are depicted. p values from pairwise comparisons are as indicated in Fig. 2A. *p<0.05, **p<0.005 compared to respective no-SP-A treated condition. Purified T cells from OVA-primed mice were activated with different amounts of ovalbumin and varying ratios of OVA-primed BMDCs to establish different levels of signaling. Ratios depicted (4D) include those with 10,000 BMDCs for 100,000 purified T cells (1:10) or 3350 BMDCs for 100,000 T cells (1:30). Control Ig or exogenous SP-A (20 μg/ml) treatment was performed as indicated in the plots. The activation culture was performed for a total of 65 h, with a [3H]-thymidine pulse during the last 15 h. Data is represented as mean fold difference to corresponding ratios of non-primed BMDCs and T cells without OVA. An increased cpm in the control conditions corresponds to greater signal strength, as indicated by the scale bar on the plots. *p<0.05, **p<0.02 compared to respective control Ig treated conditions. Data is representative of three to five independent experiments with pooled cells obtained from 3-4 mice per experiment.

