
Figure 3.
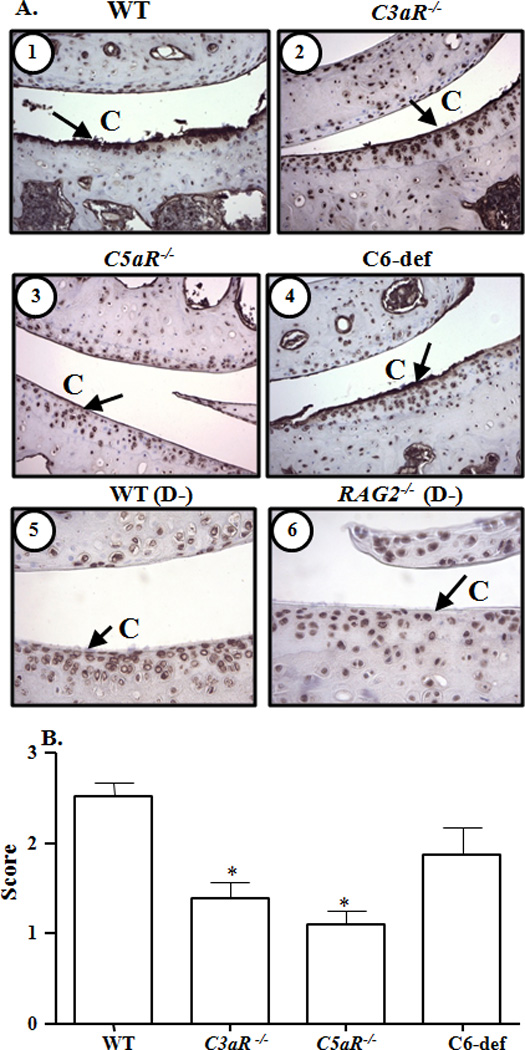
Immunohistochemical analysis of IgG deposition on the surface of cartilage from knee joints of WT, C3aR−/−, C5aR−/−, and C6-def mice with CAIA. A. Cartilage surface in the knee joints is marked as (C). IgG deposition (brown color stain) on the cartilage surface is shown by black arrows. Top panel left to right, cartilage surface from the knee joints of: 1. WT mice, and 2. C3aR−/− mice, both with CAIA. Central panel left to right: 3. C5aR−/− mice, and 4. C6-def mice, both with CAIA. Bottom panel left to right: 5. C57BL/6 mice, and 6. RAG2−/− mice, both without CAIA. Magnification in all pictures was 40X to show the surface of cartilage. B. Quantification of IgG deposition in the joints of all WT, C3aR−/−, C5aR−/−, and C6-def mice. At day 10 following Arthrogen injection, mice were sacrificed and IgG deposition was scored on a scale of 0–3. Endogenous IgG was considered as normal background levels and knee joints from RAG2−/− mice on a C57BL/6 background naturally lacking IgG were used as negative controls. All data represent the mean ± SEM based on n = 21 for WT, n = 13 for C3aR−/−, n = 11 for C5aR−/−, and n= 8 for C6-def mice. *p < 0.001 in comparison with WT mice, by Tukey’s multiple comparison test.