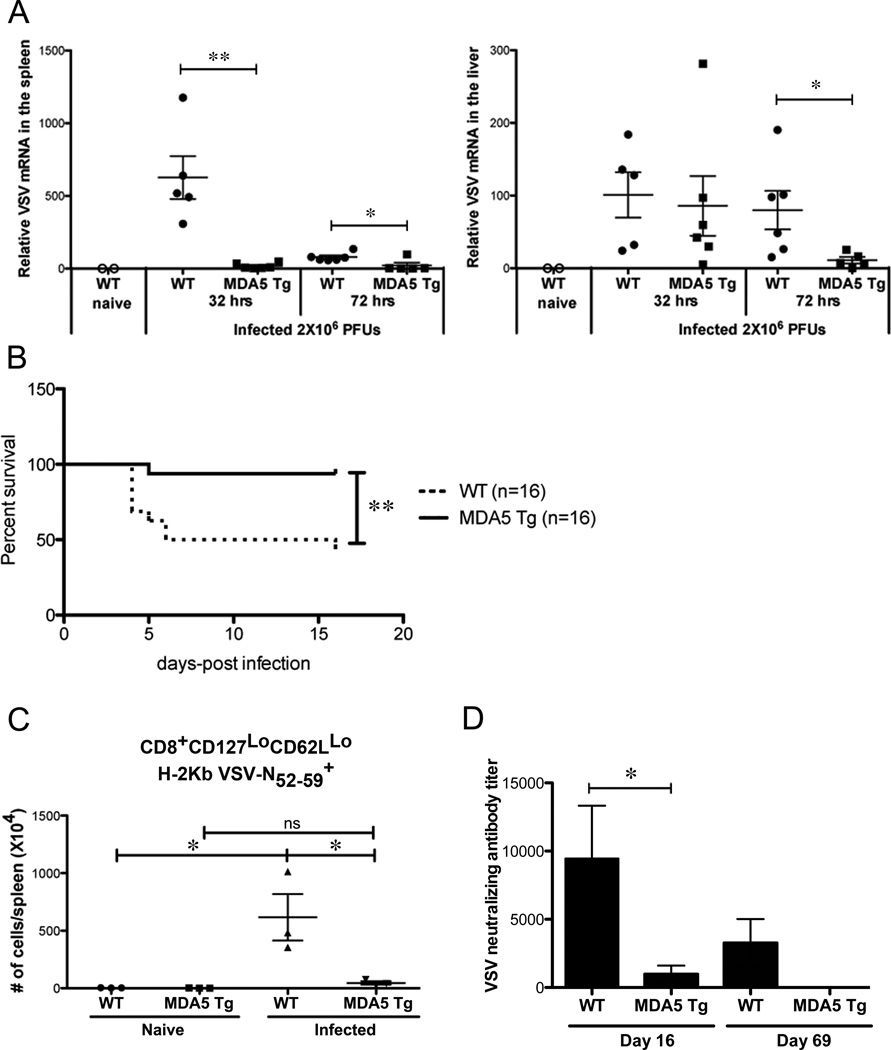
Figure 4. MDA5 Tg mice are resistant to lethal VSV infection.
(A) WT or MDA5 Tgs mice were infected with 2×10⁶ PFU VSV and at 32 and 72 hrs post-infection, spleen and liver RNA was isolated. VSV L-gene mRNA was detected using real-time PCR. Results are expressed as values from a standard curve generated from in vitro infected vero cells (see methods). Each dot represents a single mouse. Data are pooled from 2 independent experiments. (B) WT or MDA5 Tgs were challenged with 200×106 PFU VSV i.v. (the LD50) and monitored for survival. (C) WT or MDA5 Tg mice were infected i.v. with 2×10⁶ PFU VSV and splenic antigen-specific CD8 T cells were measured 8 days later using fluorochrome-labeled H-2Kb/peptide pentamers. Each dot represents absolute number of cells from the indicated gate. Three independent experiments were performed with similar results. A representative experiment is shown. (D) WT or MDA5 Tg mice were infected with VSV, sera were collected 16 and 69 days later and tested for neutralizing activity to VSV in vitro. Neutralizing antibody titer is determined by the dilution required to inhibit 50% of plaque colonies. One of two similar experiments shown. n=3 mice in each group. For A and D, a statistical T-test was performed. For B, Log-rank (Mantel-Cox) and Gehan-Breslow-Wilcoxon tests were performed with similar P values. *P<0.05, **P<0.01.

