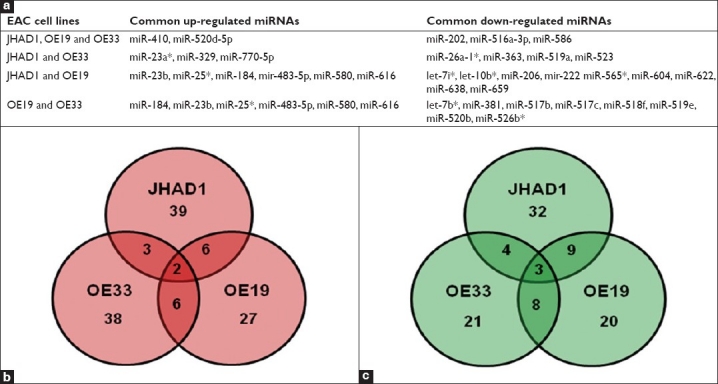
Figure 2.

Effects of C-PAC treatment on miRNA expression patterns in JHAD1, OE19 and OE33 esophageal adenocarcinoma cell lines. (a) Details of commonly up and downregulated miRNAs following a 6-hour C-PAC treatment by cell line; (b) Venn diagram illustrating the number of C-PAC upregulated miRNAs in each cell line; (c) Venn diagram illustrating the number of downregulated miRNAs associated with C-PAC treatment
