Figure 1.

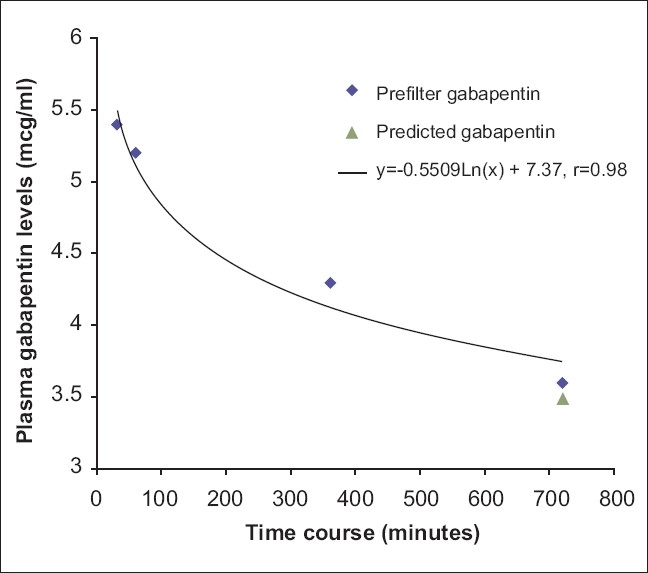
Plasma gabapentin levels vs time. Serum gabapentin levels are plotted as a function of their concentration (mcg/ml) with respect to duration of dialysis

Plasma gabapentin levels vs time. Serum gabapentin levels are plotted as a function of their concentration (mcg/ml) with respect to duration of dialysis