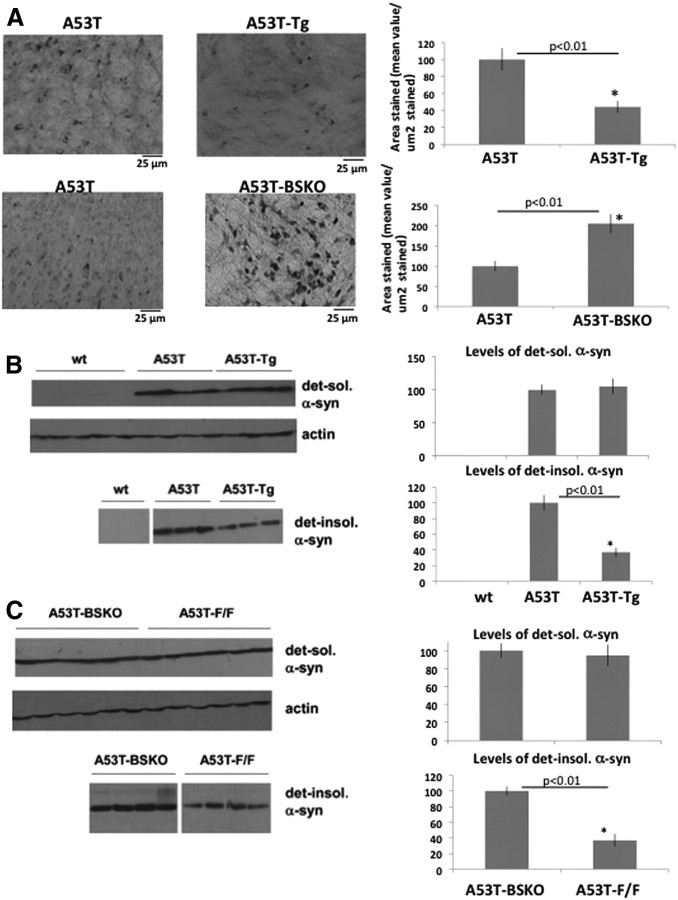
Figure 3.
SIRT1 decreases α-synuclein aggregates in A53T mouse brain A, Immunostaining of α-synuclein aggregates in the brainstem sections of A53T and A53T-Tg mice (top panel) and A53T-F/F and A53T-BSKO mice (bottom panel). Quantification is shown on the right. n = 6 for each genotype. The statistical analysis was performed using Student's t test, and significant differences are demonstrated by single asterisk (*) indicating p < 0.01. Error bars in figures represent SEM. B, Western blotting of detergent-soluble (top panel) and detergent-insoluble (bottom panel) α-synuclein fractions extracted from whole brain of indicated mice (1 mouse per lane). n = 6 for each genotype. Quantification is shown on the right. Representative blots are shown. C, Western blotting of detergent-soluble (top panel) and detergent-insoluble (bottom panel) α-synuclein fractions extracted from whole brain of indicated mice (1 mouse per lane). n = 6 for each genotype. Representative blots are shown. Quantification is shown on the right. The statistical analysis in B and C was performed using Student's t test, and significant differences are demonstrated by a single asterisk (*) indicating p < 0.01. Error bars in figures represent SEM.

