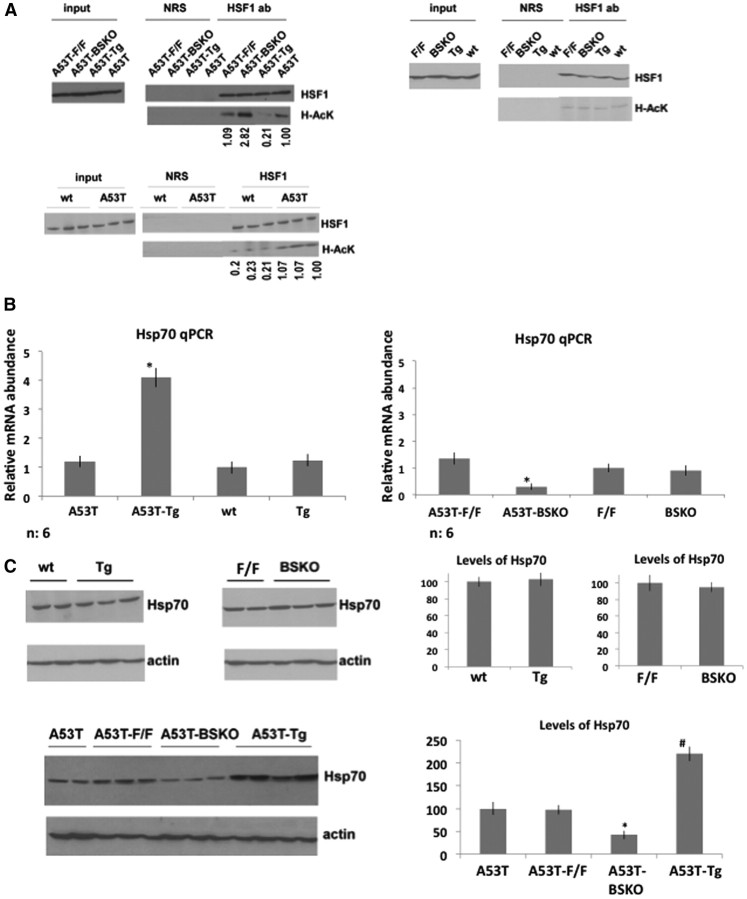
Figure 4.
SIRT1 deacetylates HSF1 and increases Hsp70 levels in brains of A53T mice. A, Left, Whole-brain extracts from A53T mice: A53T-wt, A53T-Tg, A53T-F/F, and A53T-BSKO immunoprecipitated with NRS or anti-HSF1 antibody and blotted with anti-HSF1 or anti-acetyl lysine (H-AcK) antibodies. Right, Whole-brain extracts from mice without A53T α-synuclein gene: wt, Tg, F/F, and BSKO immunoprecipitated with NRS or anti-HSF1 antibody and blotted with anti-HSF1 and anti-acetyl lysine (H-AcK) antibodies. n = 4 for each genotype. Representative immunoblots are shown. Bottom panel, Whole-brain extracts from A53T mice and wt littermates were immunoprecipitated with NRS or anti-HSF1 antibody and blotted with anti-HSF1 and anti-acetyl lysine (H-AcK) antibodies. n = 6 for each genotype. Representative immunoblots are shown. Acetylated bands are quantified by using ImageJ program. B, Hsp70 RNA levels quantified from whole brains of mice by qPCR. n = 6 for each indicated genotype. The statistical analysis is performed by using two-way ANOVA; significant differences are demonstrated by a single asterisk (*) indicating p < 0.01. Error bars in figures represent SEM. C, Western blotting of Hsp70 protein extracted from whole brains of wt, Tg, F/F, and BSKO mice without (top panel) or with the A53T α-synuclein gene (bottom panel). n = 4 for each genotype. Representative immunoblots are shown. Quantification is shown on the right. For the top panel, statistical analysis was performed using Student's t test, and significant differences are demonstrated by a single asterisk (*) indicating p < 0.01. For the bottom panel, statistical analysis was performed by using two-way ANOVA, and significant differences are demonstrated by single asterisk (*) and pound sign (#) indicating p < 0.01. Error bars in figures represent SEM.

