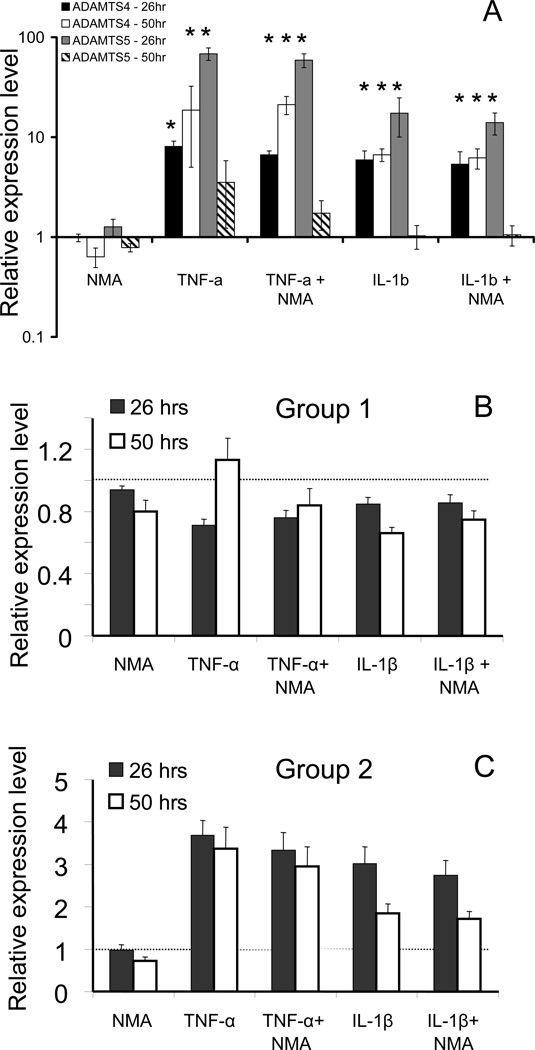
Figure 5.
Relative gene expression by real-time PCR and clustering analyses. (5A) Expression of ADAMTS4 and ADAMTS5 at 26 and 50 hour time points, relative to controls, in response to treatment with L-NMA alone, IL-1β ± L-NMA and TNF-α ± L-NMA. (5B) Centroid profile for gene cluster 1 (group-1 genes) which showed decreased expression or were unchanged in response to cytokine treatment. Centroids represent 26 and 50 hour time points clustered together. (5C) Centroid profile for gene cluster 2, showing genes that were upregulated in response to cytokine treatment. (Groups produced from clustering 26 hours alone (see Table 1) vs. 26 and 50 hours together were identical, except IGF-2 and TIMP-3 in Table 1 swapped groups. The * indicates statistical significance compared to the untreated control sample by pair-wise comparison (Wilcoxan Sign Rank test with Bonferroni correction for multiple comparison; p<0.05)

