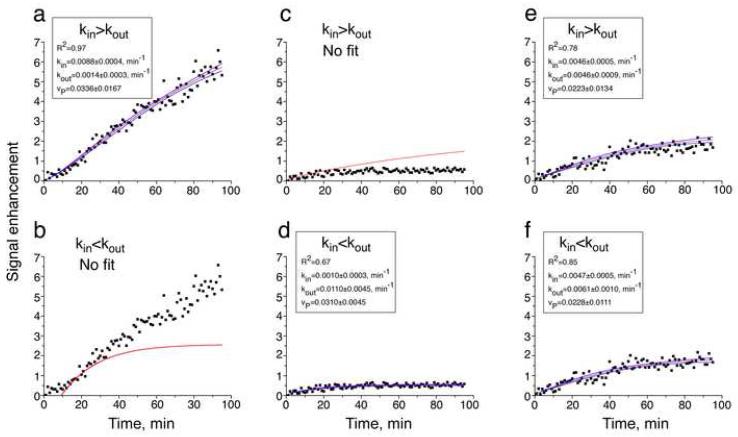
Figure 3.
Examples of typical enhancement time curves and their best fit and 95% confidence interval. The enhancement curves were fitted to Equation 1 under condition (i) kin>kout and (ii)kin<kout. Note the high R2 in a and d and the lack of fitting in b and c. Also note the higher R2 in f as compared to e.
The enhancement datasets were analyzed using Origin version 6.1

