
Figure 1.
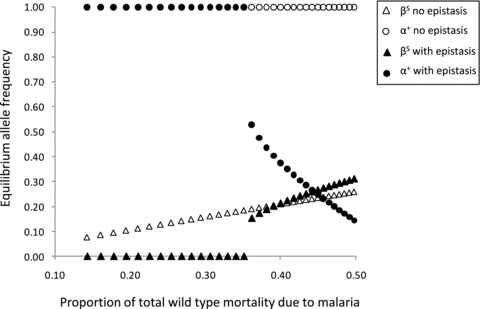
This figure shows how the equilibrium frequencies of α+ and βS change with differing levels of malaria selection, with and without negative epistasis. These equilibrium frequencies are obtained after 150,000 years; α+ and βS both started out at a frequency of 0.001 in the population. The blood disorder mortality rates and relative susceptibility to death from malaria for each genotype are the unbracketed figures given in Table S1 (figures in italics were used in the “no epistasis” scenario).