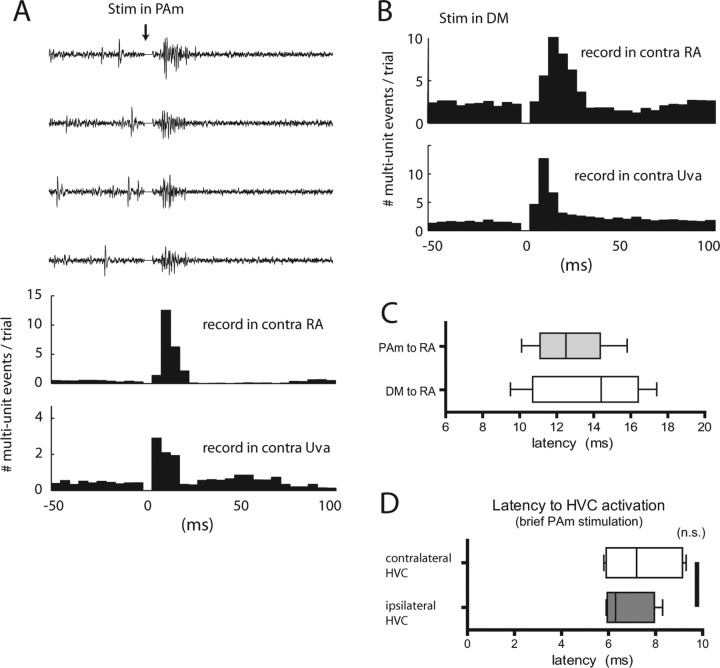
Figure 2.
Stimulation of the respiratory brainstem activates contralateral Uva, RA, and HVC. A, Effect of PAm stimulation on activity in contralateral Uva and RA. Middle, PSTH of RA activity after 100 stimulations in PAm of which four sample multiunit traces are shown above the histogram. Stimulation occurred at time 0 and the stimulus artifact has been removed from the neural traces and the PSTH. The bottom panel represents the PSTH of activity recorded simultaneously in Uva contralateral to the PAm stimulation site. In this example, stimulation consisted of two 400 μs wide, 60μA biphasic pulses within 2 ms. B, Effect of DM stimulation on activity in contralateral Uva and RA. PSTH of activity recorded in the contralateral RA and Uva after stimulation in the left DM. C, Latency for contralateral RA responses after stimulation in PAm and DM. Latency was measured from the sum of the poststimulus traces, each rectified and smoothed with a Gaussian filter, as the time from the beginning of stimulation to the time to reach half of the peak value of this summed trace. D, Latency to activate both the contralateral (white) and ipsilateral (gray) HVC after stimulation in PAm. Latency distribution for C and D is shown as a box-and-whisker plot.

