
Figure 3.
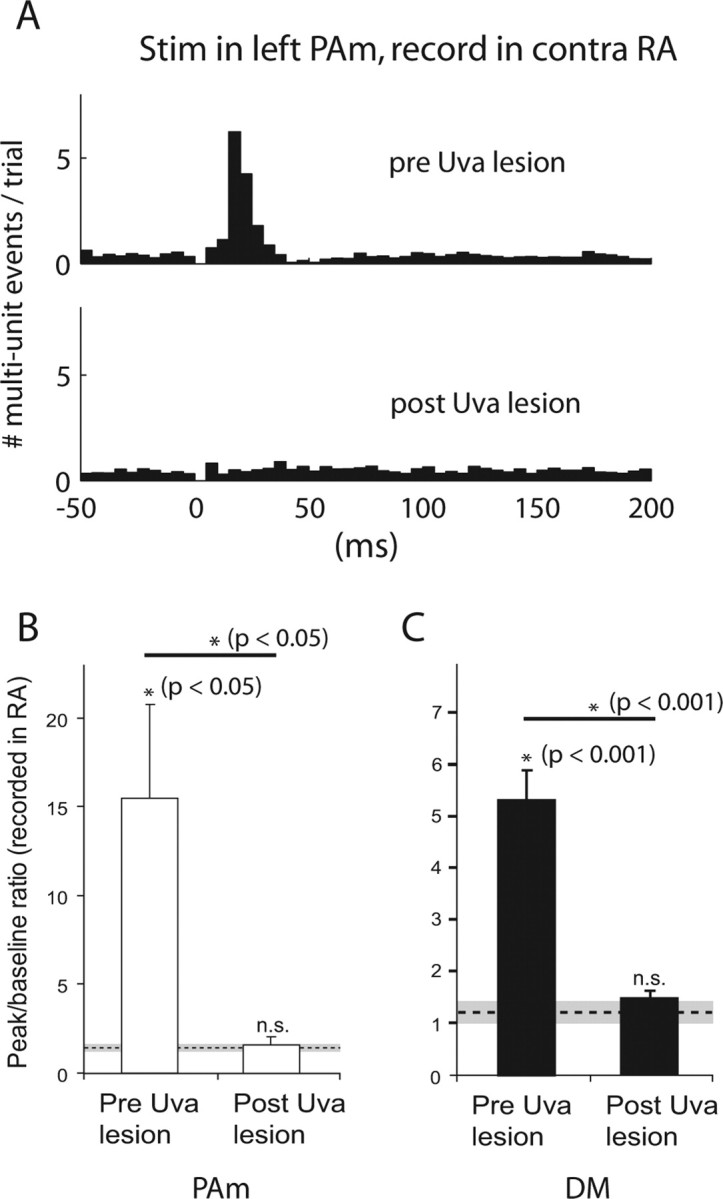
Lesions of Uva block brainstem to forebrain signal propagation. A, PSTH showing activity after stimulation in the left PAm recorded in the contralateral RA, before and after electrolytic lesions of the right Uva. B, Comparison of evoked responses before and after Uva lesion. Measurements of evoked responses in RA (contralateral to stimulation) are shown for birds receiving stimulation in PAm (n = 4). The y-axis values indicate the mean peak-to-baseline ratio for each group (see Materials and Methods). The dotted line represents the mean control peak-to-baseline value calculated before Uva lesions (n = 4), and the gray area represents two SDs from this mean. Error bars represent SEM. Asterisks indicate significance for the group by one-tailed paired t tests, wherein each bird was paired with either its own control peak-to-baseline value, or paired before and after Uva lesions. C, Comparison of evoked responses from stimulation in DM (n = 9) before and after Uva lesions.