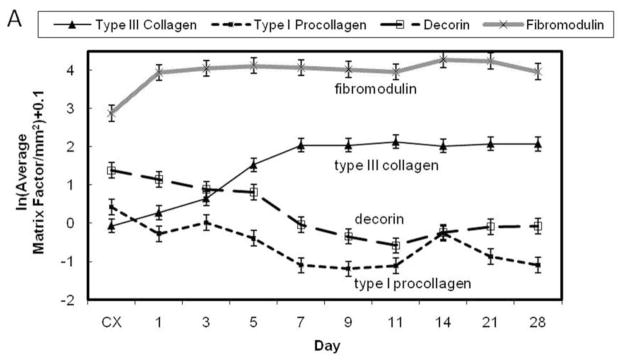
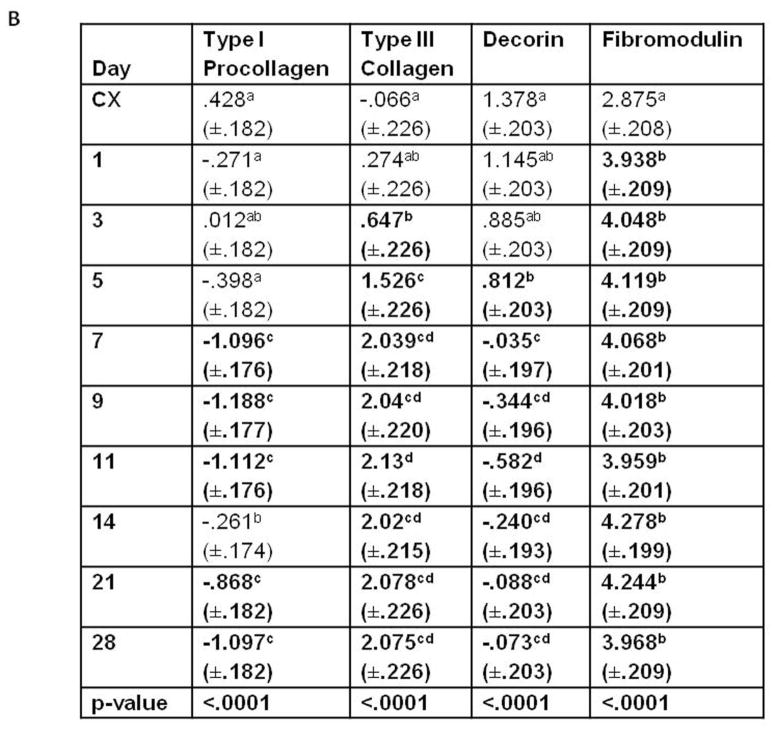
Figure 5.
Temporal localization of the ECM factors by the healing ligament. A) Graph illustrating the temporal pattern of type I procollagen, type III collagen, fibromodulin, and decorin. B) Table demonstrating the temporal significance between days of each factor. Significance was based on p < .05. Within each column, significant differences are discerned by letters (a,b,c,d). Bold numbers indicate the most significant changes from the control values.


