
Figure 6.
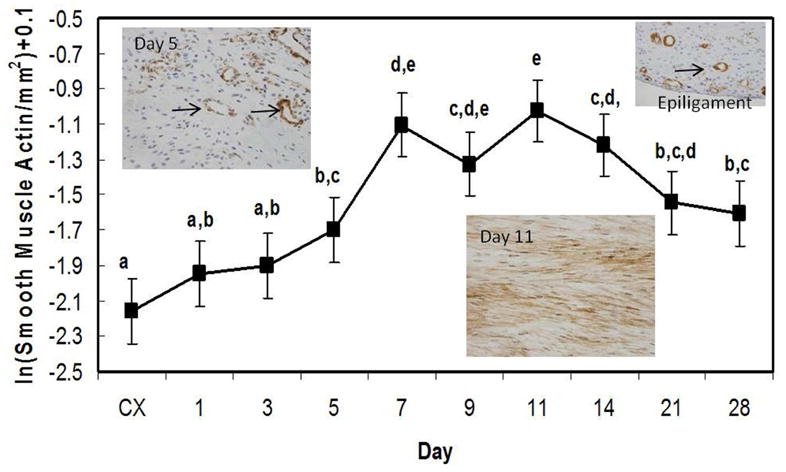
Production of α-smooth muscle actin by the healing ligament. Significance was based on p < .05. Significant differences are discerned by letters (a,b,c,d,e). Insets depict the healing ligament at day 5 (left), day 11 (middle), or epiligament (right) stained for α-SMA. Arrows indicate examples of blood vessel staining in the day 5 and epiligament insets. Myofibroblasts predominate at day 11 (middle inset).