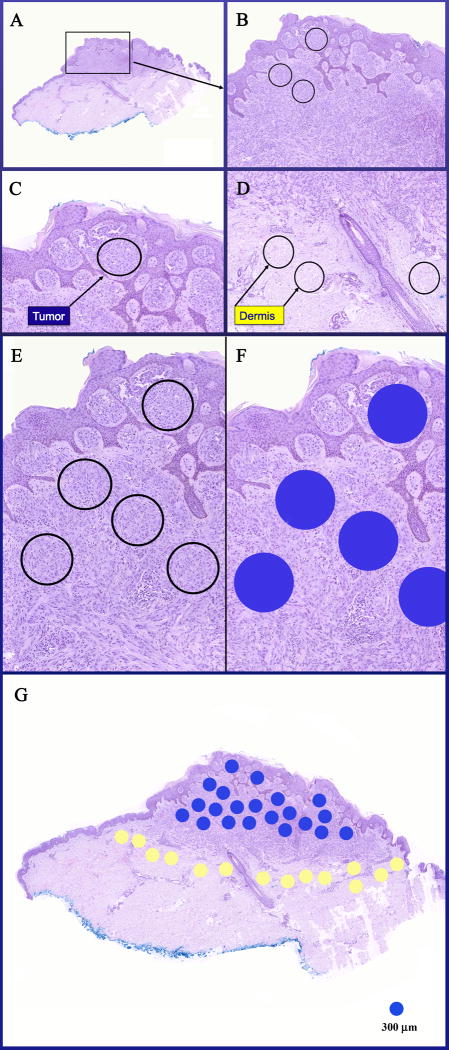
Figure 2.
A case of SMM (case 53) with circled foci marking the locations of the tumor (melanocytic) and dermal (TME) components to be studied by IMS. A&B: Low power views of an asymmetric melanocytic proliferation in the dermis. C, E, &F: Densely cellular areas of tumor containing pure population of melanocytes without intervening epithelial component, vessels, and collagen are selected for IMS analysis and marked blue for tumor. D: Circled areas in the dermis representing TME to be studied by IMS. G: An entire section with multiple foci marked blue for tumor and yellow for dermis to be subjected to IMS analysis. Each dot is with a diameter of 300 μm.

