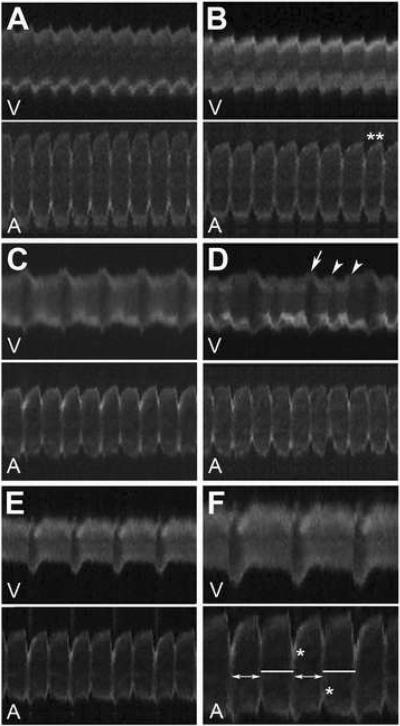
Figure 2.
Cardiac contraction profiles of chemically-treated Tg(cmlc2:GFP) zebrafish embryos at 2 dpf. (A) Niguldipine-treated embryos; (B) Pimozide-treated embryos, double asterisk (**) mark anomaly in interval between contractions; (C, D) Amiodarone-treated, white arrow and arrowheads mark phases of major and minor relaxation, respectively; (E, F) Fluspirilene-treated, lines and double headed arrows denote relaxation periods alternating between 0.63 and 0.525 s, respectively. Maximum atrial wall contraction is marked by an asterisk (*). V: ventricle line scan; A: atrial line scan.

