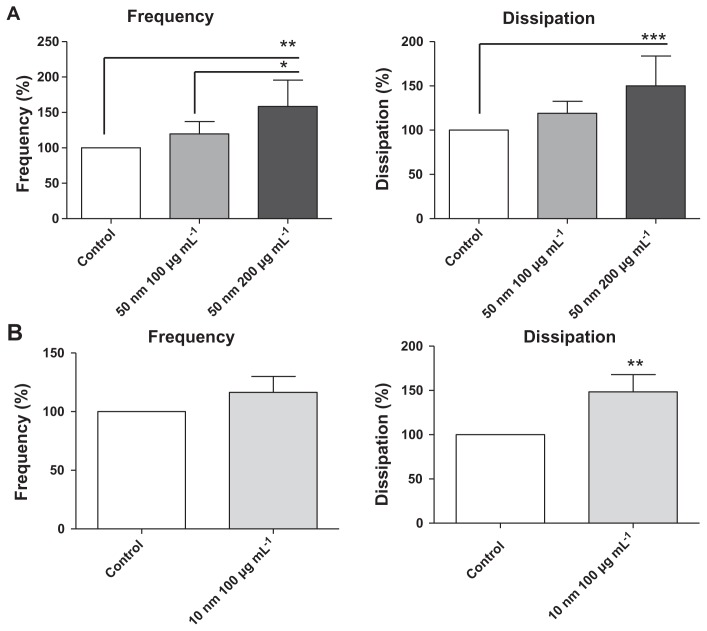
Figure 3.
Quantitative analysis of the effects of silica nanoparticles on frequency and energy dissipation (from the third overtone), where the maximal changes in frequency (negative shift) and dissipation (positive shift) for the control are considered as 100%. (A) Incubation of platelets with 50-nm silica nanoparticles at concentrations up to 200 μg mL−1 significantly induced changes in frequency and dissipation. (B) Incubation of platelets with 10-nm silica nanoparticles (100 μg mL−1) significantly induced changes in dissipation.
Notes: Data are expressed as mean ± standard deviation. *P < 0.05; **P < 0.01; ***P < 0.001.

