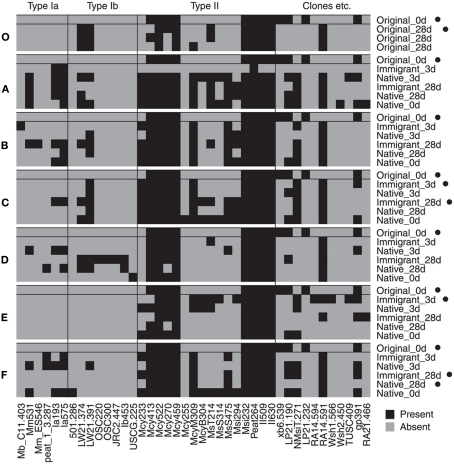
Figure 3.
Binary map of microarray results. Each site (A–F and O) is showed separately together with the original 0 day sample data for comparison. Microarray analysis was successful for only one of three parallel inactive original_0 day samples. Samples that were inactive in CH4 oxidation at the time of sampling are marked with a black dot (•). Only probes with a positive hybridization signal (≥3 after normalization of the data to the scale of 0–100) on any of the samples are shown (universal MOB probes were not included). Binary results were converted from the semiquantitative data presented as a heatmap in the Figure A2 in Appendix.

