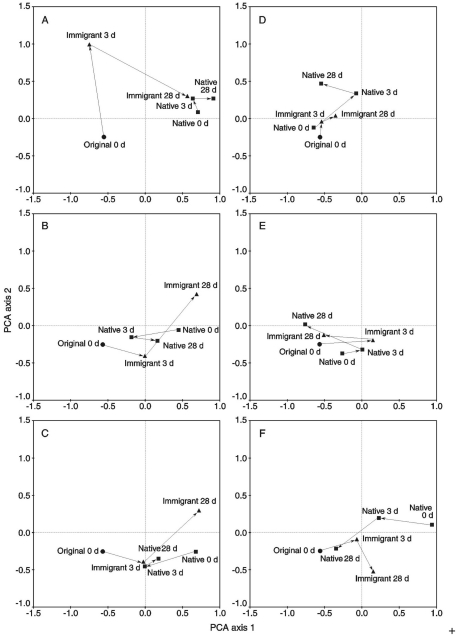
Figure A1.
The principal component analysis (PCA) results of the binary microarray data divided into transplantation sites (A–F) (original 0 day = original inactive moss, original 28 days = original moss transplanted back to the original site, immigrant = original moss transplanted to the active flark site, native = native moss of the active flark site). The first and second PCA axes explain 25 and 11% of the compositional variation, respectively.

