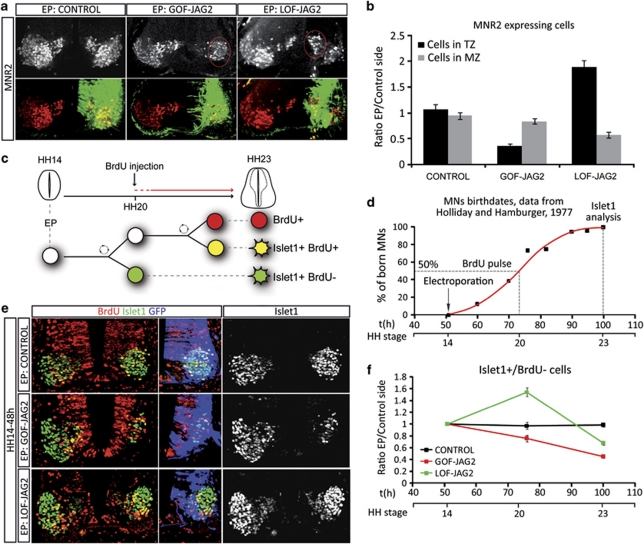
Figure 2.
Jagged2 activity controls the timely differentiation of MNs. (a) Embryos electroporated (EP) at HH14, with the indicated DNAs, were analysed at 72 h post EP with the early MN marker MNR2 (red). EP side is shown to the right, GFP (green) shows transfected cells. Quantification of motor neurons and their spatial distribution was performed analysing confocal images. (b) Histograms represent the number of MNR2-positive cells depending on the distance to the lumen; TZ, transition zone; MZ, mantle zone. (c) Schematic representation of the MN birth dating experiments following Jagged2 manipulations. Embryos EP at HH14 were labelled with a single BrdU pulse 24 h PE, and analysed at 48 h PE for BrdU/MN markers. (d) Schematic representation of motor neurons birth dates in the brachial spinal cord of the chick embryo, data adapted from Hollyday and Hamburguer.26 (e) Example sections showing double staining for the MN marker Islet1 (green) and BrdU (red). EP side is shown to the right, GFP (blue) shows transfected cells. (f) Quantitative data showing the proportion of born MNs, plots correspond to the ratio of EP versus non-EP side in each experimental condition (control, black dots; GOF-Jag2, red dots; LOF-Jag2, green dots). Time is represented as hours of incubation and HH stages. First dot corresponds to the EP time, second to the BrdU−/Islet1+ cells (MNs born at the time of the BrdU pulse), third dot represents the total Islet1+ cells (MNs terminally differentiated 48 h PE). Bars correspond to the standard error (S.E.M.)

