Figure 3.
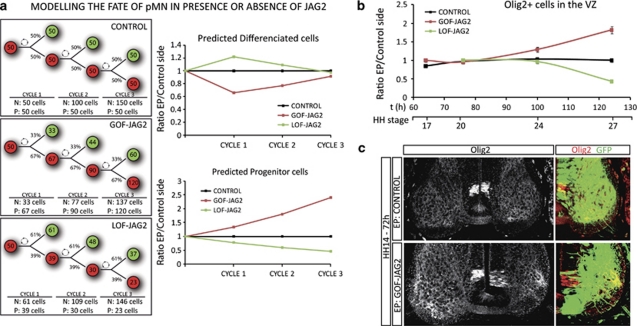
Overexpression of Jagged2 retains Olig2+ cells in a progenitor stage. (a) Model representing the fate of pMN progenitors along three cell cycles, in control situation in which 50% divisions are asymmetric, giving rise to one MN (green) and one progenitor cell (red). Percentages of asymmetric divisions are adapted from data provided by BrdU incorporation experiments in the presence or the absence of Jagged2. Drawing shows the resulting proportion of neurons (N) and progenitors (P). Plots represent the ratio of theoretical MNs generated in each condition, dots correspond to each cell cycle. Plots represent the ratio of theoretical progenitors that remain in each condition, dots correspond to each cell cycle. (b) Quantitative data showing the ratio of Olig2+ cells, plots correspond to the ratio of EP versus non-EP side in each experimental condition (control, black dots; GOF-Jag2, red dots; LOF-Jag2, green dots). Time is represented as hours of incubation and HH stages. Dots correspond to 12 h 24 h, 48 h and 72 h PE. Bars correspond to the standard error (S.E.M.). (c) Sample sections, EP with indicated DNAs, and immunostained with Olig2 (red). EP sides are shown to the right, GFP (green) shows transfected cells

