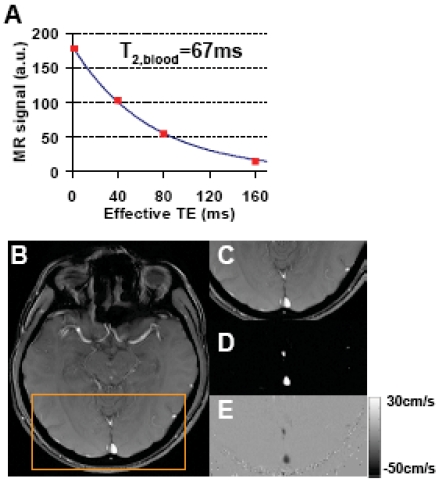
Fig. (2).
Representative data for TRUST MRI and phase-contrast MRI. A) TRUST MRI signal, i.e. control-label, in the sagittal sinus as a function of effective TE. The symbol shows the experimental results. The solid curve shows the fitting of the data to a mono-exponential function. The time constant of the decay, i.e. T2 relaxation time of the blood, is also shown. B) Anatomical image from the phase-contrast scan. C) Posterior portion of the anatomic image highlighted by the orange box. D) Magnitude image of the phase-contrast scan showing large vessels as bright signals. The two bright regions indicate the superior sagittal sinus and the straight sinus, respectively. E) Velocity map. The flow in the veins is shown in dark color because the flow direction is downwards.

