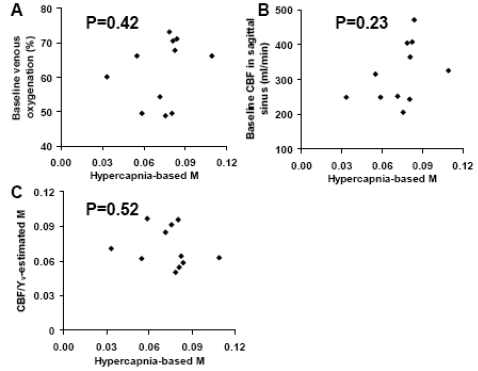
Fig. (5).
Scatter plots between variables in the model for the M factor. A) Scatter plot between hypercapnia-based M and baseline venous oxygenation. B) Scatter plot between hypercapnia-based M and baseline CBF. C) Scatter plot between hypercapnia-based M and baseline-parameter-estimated M. It was found that the hypercapnia-based M was not correlated with any of the variables associated with baseline physiology.

