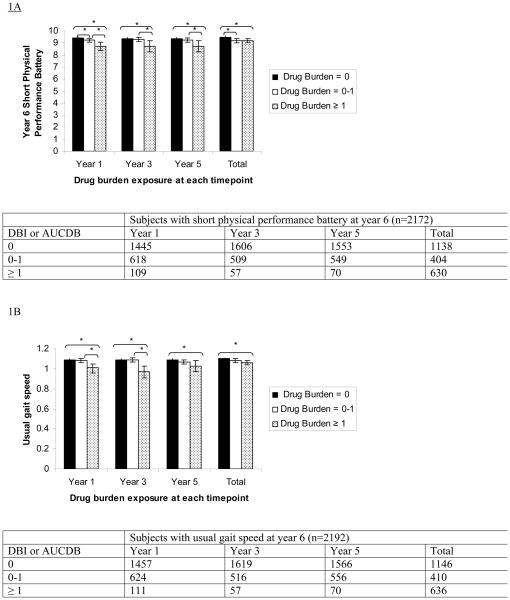
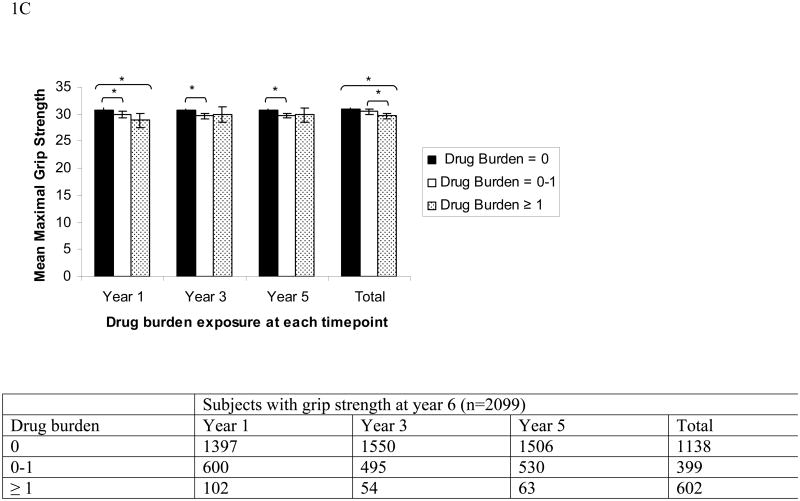
Figure 1.
Association between higher Drug Burden Index (DBI) at years 1, 3 and 5, and total drug burden exposure over five years, calculated using area under the drug burden time curve (AUCDB), with lower functional scores at year 6 measured with SPPB score (A), usual gait speed in m/s (B) or grip strength in kg (C).
DBI and AUCDB grouped into 0, 0-1 and ≥ 1. Means adjusted for year 1 functional score, co-morbidities, hospitalizations and sociodemographic factors using analysis of co-variance.
Error bars show 95% confidence intervals. * indicates that the difference between bars linked by brackets is statistically significant, p<0.05. Number of subjects at each level of exposure at each time point is shown in table below each figure.


