Figure 1.

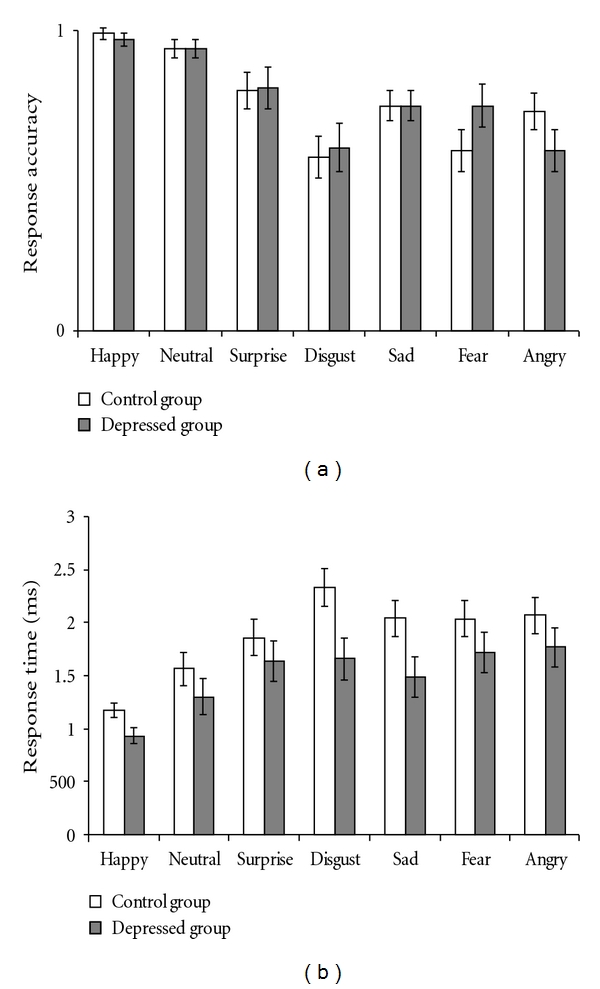
The means and standard error of response accuracy (i.e., percent of correct responses) (a) and response time (b) across each of the seven categories facial expression by the high- and low-depression groups.

The means and standard error of response accuracy (i.e., percent of correct responses) (a) and response time (b) across each of the seven categories facial expression by the high- and low-depression groups.