Figure 5.

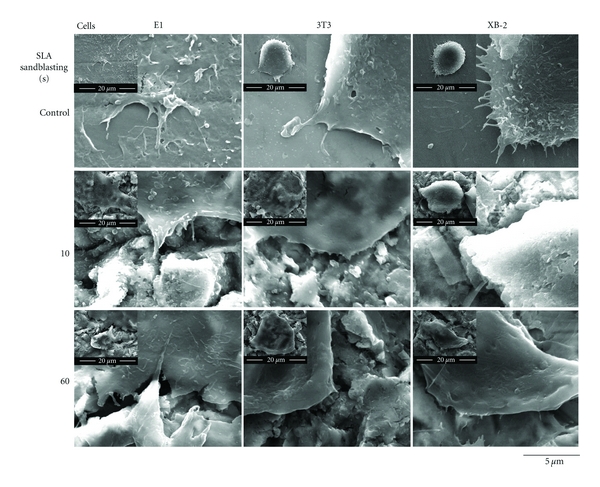
SEM images showing the proliferative morphologies of the various cells growing on areas of varying roughness in the control and test groups after 10, 30, and 60/30 sec of blasting and etching after 24 h.

SEM images showing the proliferative morphologies of the various cells growing on areas of varying roughness in the control and test groups after 10, 30, and 60/30 sec of blasting and etching after 24 h.